本文由 AI(Trae Agent) 检索、整理并撰写,尚未经过人工逐条校对。文中所有数字都来自随文附带的十五个 Python 脚本的真实运行结果(experiments/01_history.py 至 15_timing.py),可在普通 CPU 上重跑;所有图由脚本直接生成。跨物种寿命表是从 AnAge/HAGR 与原始文献中手工摘录的小样本,不是系统抽样;证据矩阵与网络连边是作者对文献的判读,不是荟萃分析。文中不讨论任何公司、企业家或个人,也不对任何在研技术作欺诈指控。所有”细胞”与”人体”模型都是玩具模型,不构成临床结论。
This article was researched and written by an AI system (Trae Agent) and has not been proofread line by line by a human. Every number comes from an actual run of the fifteen Python scripts shipped with the post (experiments/01_history.py … 15_timing.py), which run on an ordinary CPU, and all figures are produced by those scripts. The cross-species lifespan table is a small hand-curated sample from AnAge/HAGR and the primary literature, not a systematic sample. The evidence matrix and the network edges are the author’s reading of the literature, not a meta-analysis. No company, entrepreneur or individual is discussed, and no accusation of fraud is made about any programme. Every “cell” and “human” model here is a toy and supports no clinical conclusion.
写一篇中英双语研究随笔:从秦始皇求仙、道教外丹与欧洲炼金术出发,追问现代抗衰研究是否再次把对局部机制的理解误当成逆转整个生命过程的方法。用十个章节与十二个原创计算回答:衰老的进化理论、十二项衰老标志的证据网络、表观遗传时钟与真实状态的可分离性、多维衰老动力学的干预与反弹、部分重编程的安全窗、再生与癌症风险的多阶段权衡、Gompertz 竞争风险与”死亡风险归零”的数学边界、抗衰技术的证据成熟度与临床试验样本量、以及”80 岁回到 20 岁”需要修复多少个系统。严格区分实验证据、数学命题、模型结果与作者假说;不指名任何公司或个人;不编造 DOI 与技术成功概率。
A bilingual research essay that starts from Qin Shi Huang’s search for the elixir, Taoist external alchemy and European alchemy, and asks whether modern longevity research is repeating the old mistake of mistaking a local mechanism for a method to reverse a whole life. Ten chapters and twelve original computations cover: evolutionary theories of ageing, an evidence network of the twelve hallmarks, the separability of epigenetic clocks from the underlying state, multi-dimensional ageing dynamics with relapse, the safety window of partial reprogramming, the multistage trade-off between regeneration and cancer, Gompertz competing risks and the mathematical boundary of “zero death risk”, the evidence maturity and trial sample sizes of longevity interventions, and how many systems an 80-to-20 restoration would require. Experimental evidence, mathematical propositions, model output and author hypotheses are labelled separately; no company or individual is named; no DOI or probability of success is invented.
1. 皇帝与方士 / Emperors and alchemists
公元前 219 年,秦始皇东巡至海,派方士徐福入海求仙人和不死之药。这件事写在《史记·秦始皇本纪》里,是正史,不是传说。九十年后,汉武帝在长安建章宫立铜人承露盘,接甘露和玉屑服食,身边围着李少君、栾大、公孙卿一类的方士;《汉书·郊祀志》把这套仪式记得相当细。再往后,道教外丹术把”把贱金属炼成黄金”的隐喻搬到人体上,葛洪在《抱朴子内篇》里认真讨论丹砂、黄金与”尸解”的关系。唐代至少五位皇帝死于服丹,这是历史学界长期讨论的题目,但具体死因仍有争议——汞中毒是推断,不是验尸报告。
In 219 BCE, Qin Shi Huang travelled east to the sea and sent the fangshi Xu Fu to find immortals and the drug of deathlessness. This is recorded in the Shiji, the official history, not in legend. Ninety years later, Han Wudi built a bronze immortal with a dew basin in Jianzhang Palace and consumed the dew with jade powder, surrounded by fangshi such as Li Shaojun, Luan Da and Gongsun Qing; the Hanshu records the ritual in detail. Later, Taoist external alchemy moved the metaphor of transmuting base metal into gold onto the human body: Ge Hong’s Baopuzi discusses cinnabar, gold and “corpse liberation” with perfect seriousness. At least five Tang emperors died after taking such pills — a long-standing discussion among historians, though the exact cause of death remains contested: mercury poisoning is an inference, not an autopsy.
把这几件事并排放在一条时间轴上,会看到一个反复出现的结构:一个单一物质,被许诺能改变整个生命过程。丹砂、甘露、黄金、后来的腺体提取物,都是这个结构的变体。它之所以有吸引力,不是因为证据强,而是因为它把”衰老”这个由上百个过程组成的词,压缩成了一个可以被一颗药丸解决的对象。心理学的解释很朴素:人偏爱单一原因、可见的因果和权威背书;而”复杂系统在多尺度上缓慢失序”这个正确答案,既不性感,也无法被装进一个锦盒。
Put these episodes on one timeline and a recurring structure appears: a single substance, promised to alter the entire process of life. Cinnabar, dew, gold, and later glandular extracts are variants of that structure. It is attractive not because the evidence is strong but because it compresses “ageing” — a word covering hundreds of processes — into an object that one pill can address. The psychology is plain: people prefer single causes, visible causality and authority; the correct answer, “a complex system slowly losing order at many scales”, is neither seductive nor gift-wrappable.
这一节先立一条界线,后面每一节都要用到:历史类比不是现代医学无效的证明。方士没有对照、没有剂量、没有终点,也没有把失败公开;现代衰老研究有随机分组、有预注册终点、有独立重复,也有大量失败被如实发表。两者的区别不是”都许诺长生”,而是”如何对待许诺被检验之后的结果”。真正值得警惕的,不是研究本身,而是把早期机制研究直接翻译成”即将实现的返老还童”的那一步——那一步在历史上出现过很多次,在今天的语言里也仍然活着。
This section sets a boundary used throughout: a historical analogy is not evidence that modern medicine fails. The fangshi had no controls, no dosages, no endpoints and no public record of failure; modern ageing research has randomisation, pre-registered endpoints, independent replication, and a large literature of published failures. The difference is not that both promise immortality; it is what each does after the promise is tested. What deserves scrutiny is not the research but the step that translates an early mechanistic result into “rejuvenation is around the corner” — a step that has occurred many times before and is still with us in modern language.
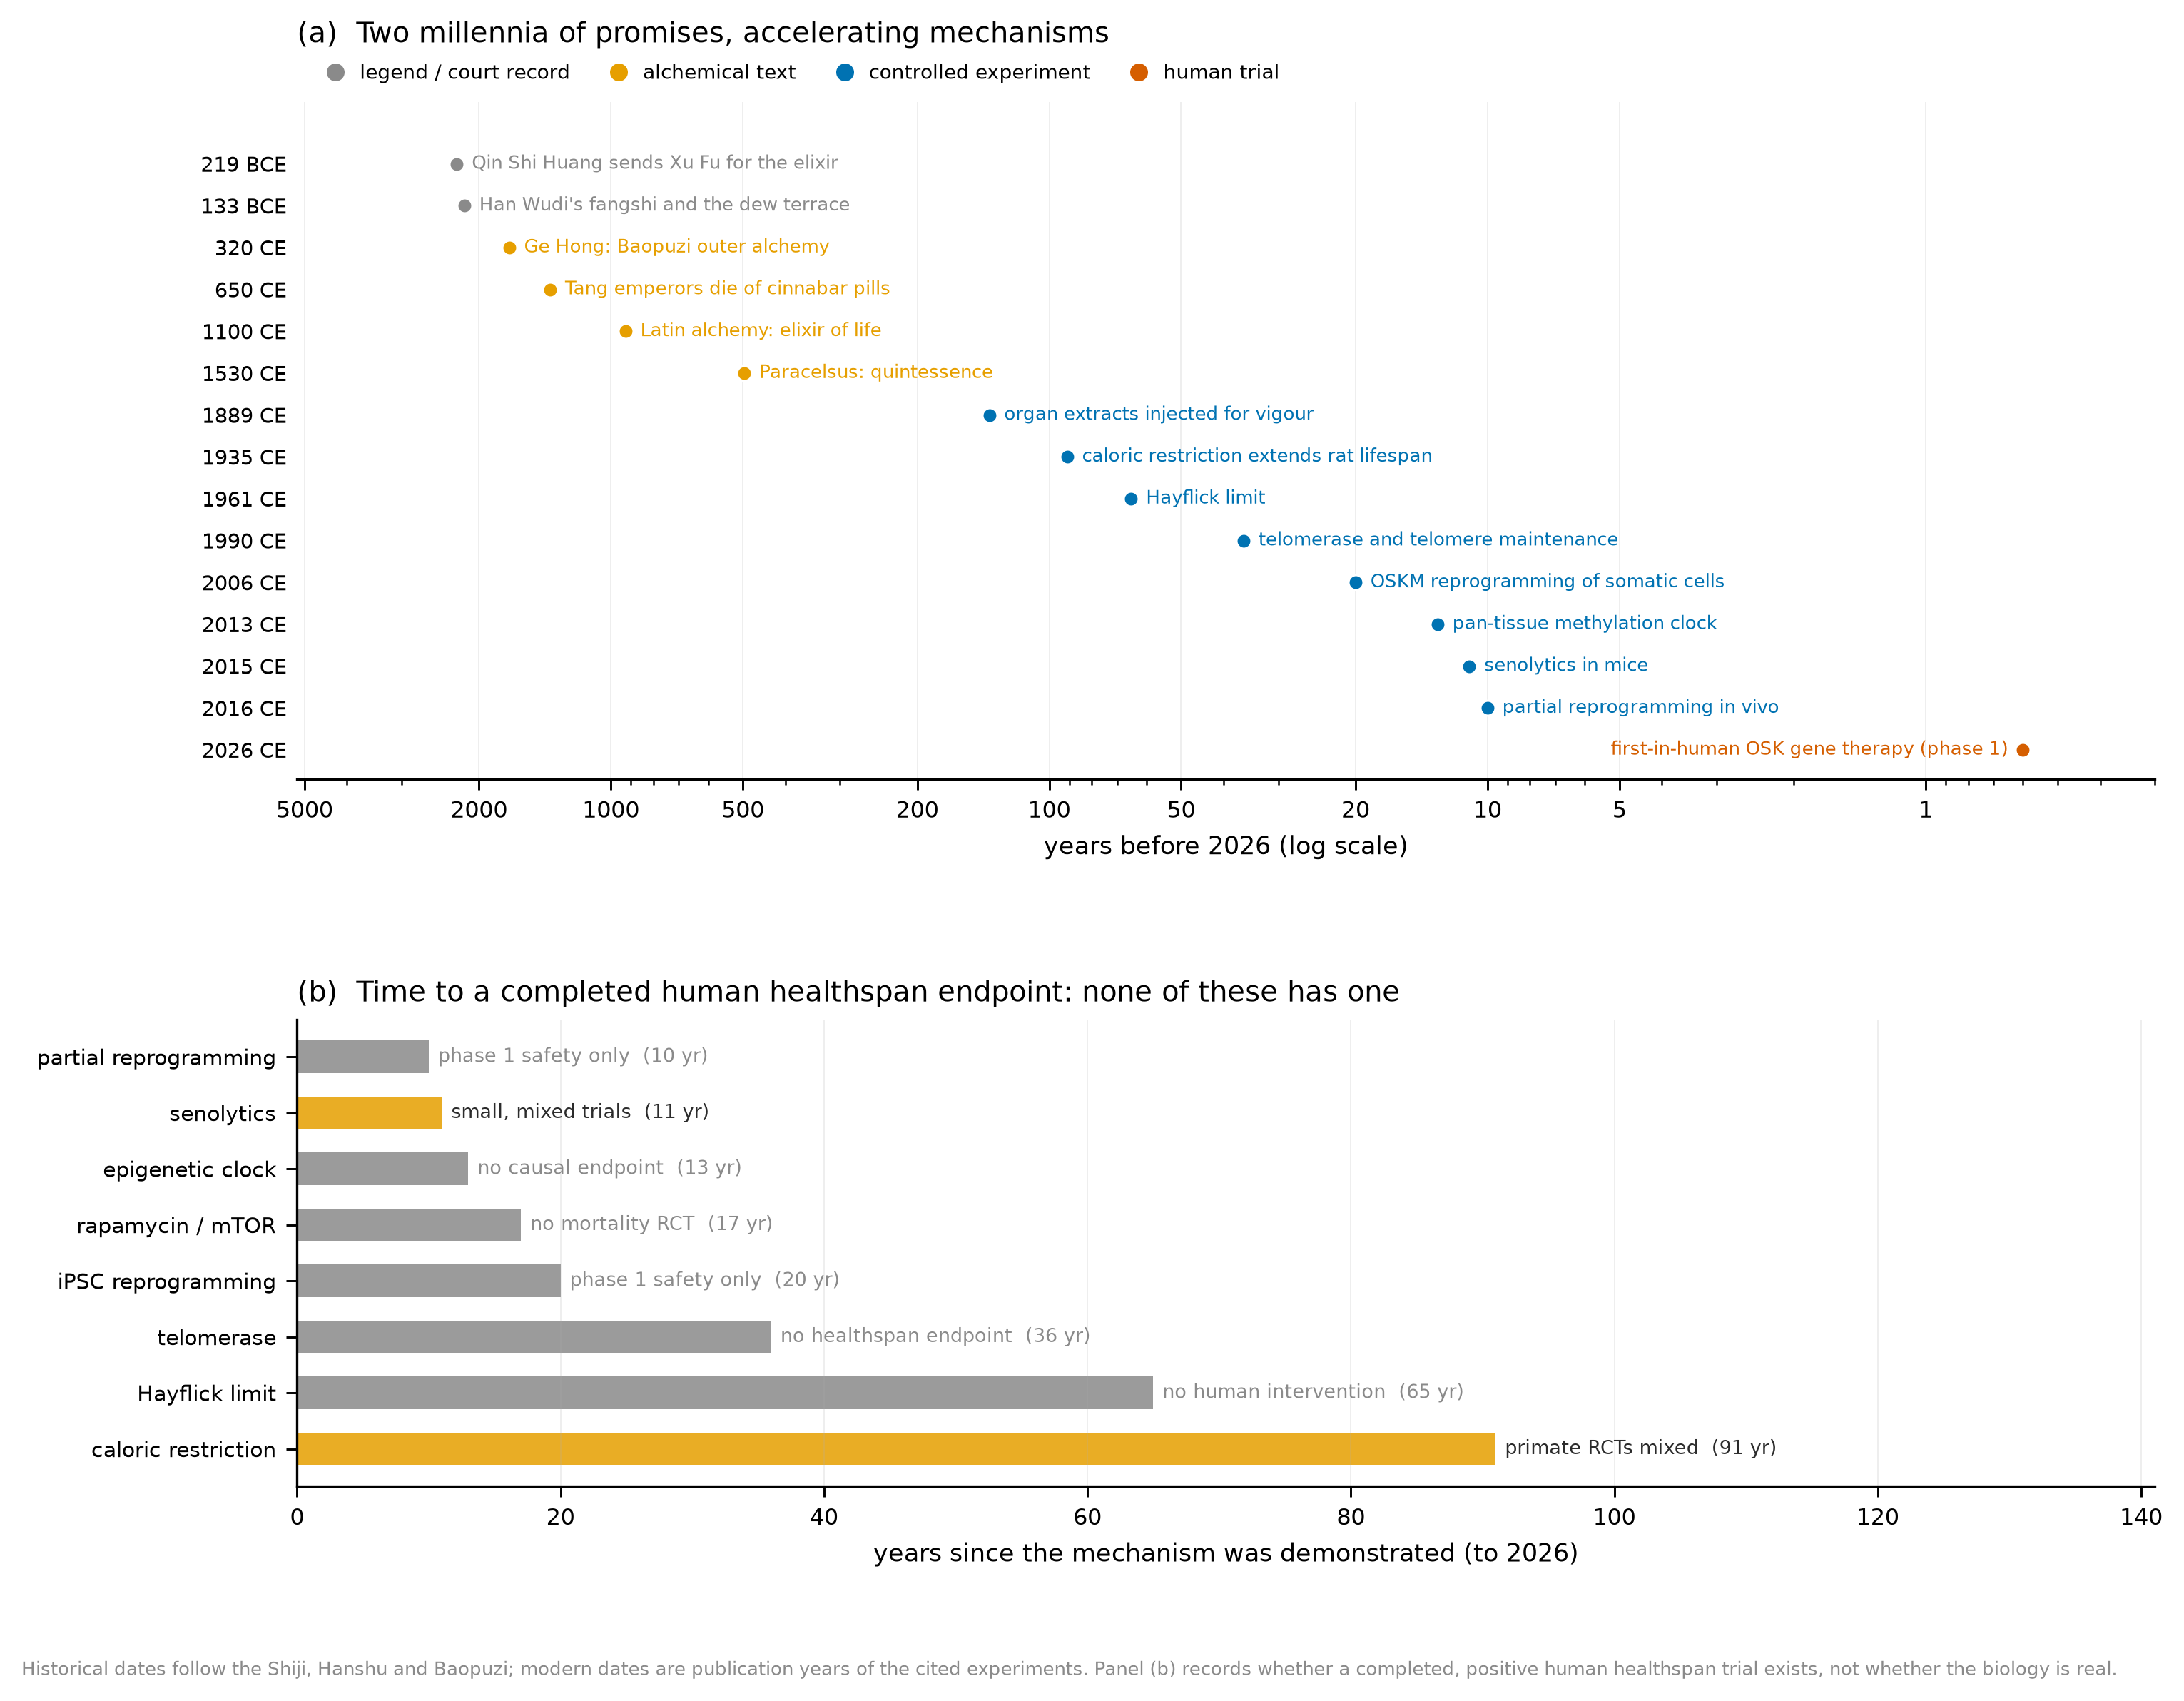
图 1 把这件事量化了一点。我收录了 15 个时间点,其中 8 个是现代意义上的机制发现,从热量限制延长大鼠寿命(1935)到表观遗传时钟(2013)与部分重编程(2016)。这些机制被证明之后,距离”完成的人体健康寿命终点试验”的中位年数是 18.5 年,最长的是热量限制,91 年;而完成这一步的数量是 0。这不是说这些机制是假的,而是说“机制为真”与”人体有效”之间,隔着一段比大多数人的耐心更长的路。
Figure 1 quantifies one part of it. I recorded 15 dated events, 8 of them modern mechanistic discoveries, from caloric restriction extending rat lifespan (1935) to the epigenetic clock (2013) and partial reprogramming (2016). The median time from such a demonstration to a completed human healthspan endpoint is 18.5 years; the longest is caloric restriction at 91 years, and the number that have completed the step is 0. This does not make the mechanisms false. It says that between “the mechanism is real” and “it works in people” lies a road longer than most patience.
本文要检验的核心问题就藏在这条时间线里:我们是否又一次把对某个局部机制的理解,误当成了逆转整个生命过程的方法? 这个问题不能用一句”是”或”不是”回答,因为”局部”与”整体”之间没有一条天然的分界线。可行的做法是把它拆成可检验的子问题:一个机制改变之后,下游有多少个系统跟着改变?改变能持续多久?在什么剂量与组织里安全?有没有一个临床终点能区分”指标好看”与”人真的更健康”?接下来的九节,就是把这四个问题分别放到进化、网络、时钟、动力学、重编程、癌症、生存分析与临床试验的框架里。
The question this article examines is hidden in that timeline: are we once again mistaking an understanding of one local mechanism for a method to reverse a whole life? It cannot be answered with a yes or a no, because there is no natural boundary between “local” and “whole”. The workable approach is to split it into testable sub-questions: when a mechanism changes, how many downstream systems change with it? How long does the change last? At what dose and in which tissue is it safe? Is there a clinical endpoint that distinguishes “better numbers” from “a healthier person”? The next nine sections put these four questions into the frameworks of evolution, networks, clocks, dynamics, reprogramming, cancer, survival analysis and clinical trials.
2. 死亡是被写进程序的吗? / Is death written into the programme?
衰老研究里最容易被误读的一句话是”衰老是程序性的”。它听起来像在说:身体里有一个时钟,到了某个年龄就启动自毁。进化生物学给出的图景恰好相反——没有为死亡而存在的程序,只有为繁殖而做的取舍。Medawar 在 1952 年指出,选择的力量随年龄下降,晚出的有害突变可以在种群中积累而几乎不被清除(mutation accumulation)。Williams 在 1957 年补上了另一半:一个基因如果在生命早期有利、在晚期有害,选择会偏爱它(antagonistic pleiotropy)。Kirkwood 在 1977 年把它写成资源分配问题:机体把有限的能量分给繁殖与维护,外源死亡风险越高,投资维护的回报越低(disposable soma)。
The most misread sentence in ageing biology is “ageing is programmed”. It sounds like a clock that triggers self-destruction at a fixed age. Evolutionary biology says the opposite: there is no programme for death, only trade-offs made for reproduction. Medawar (1952) showed that selection weakens with age, so late-acting deleterious mutations can accumulate almost unopposed. Williams (1957) supplied the other half: a gene that helps early and harms late will be favoured. Kirkwood (1977) turned it into resource allocation: energy spent on reproduction is not spent on maintenance, and the higher the extrinsic mortality, the lower the return on maintenance.
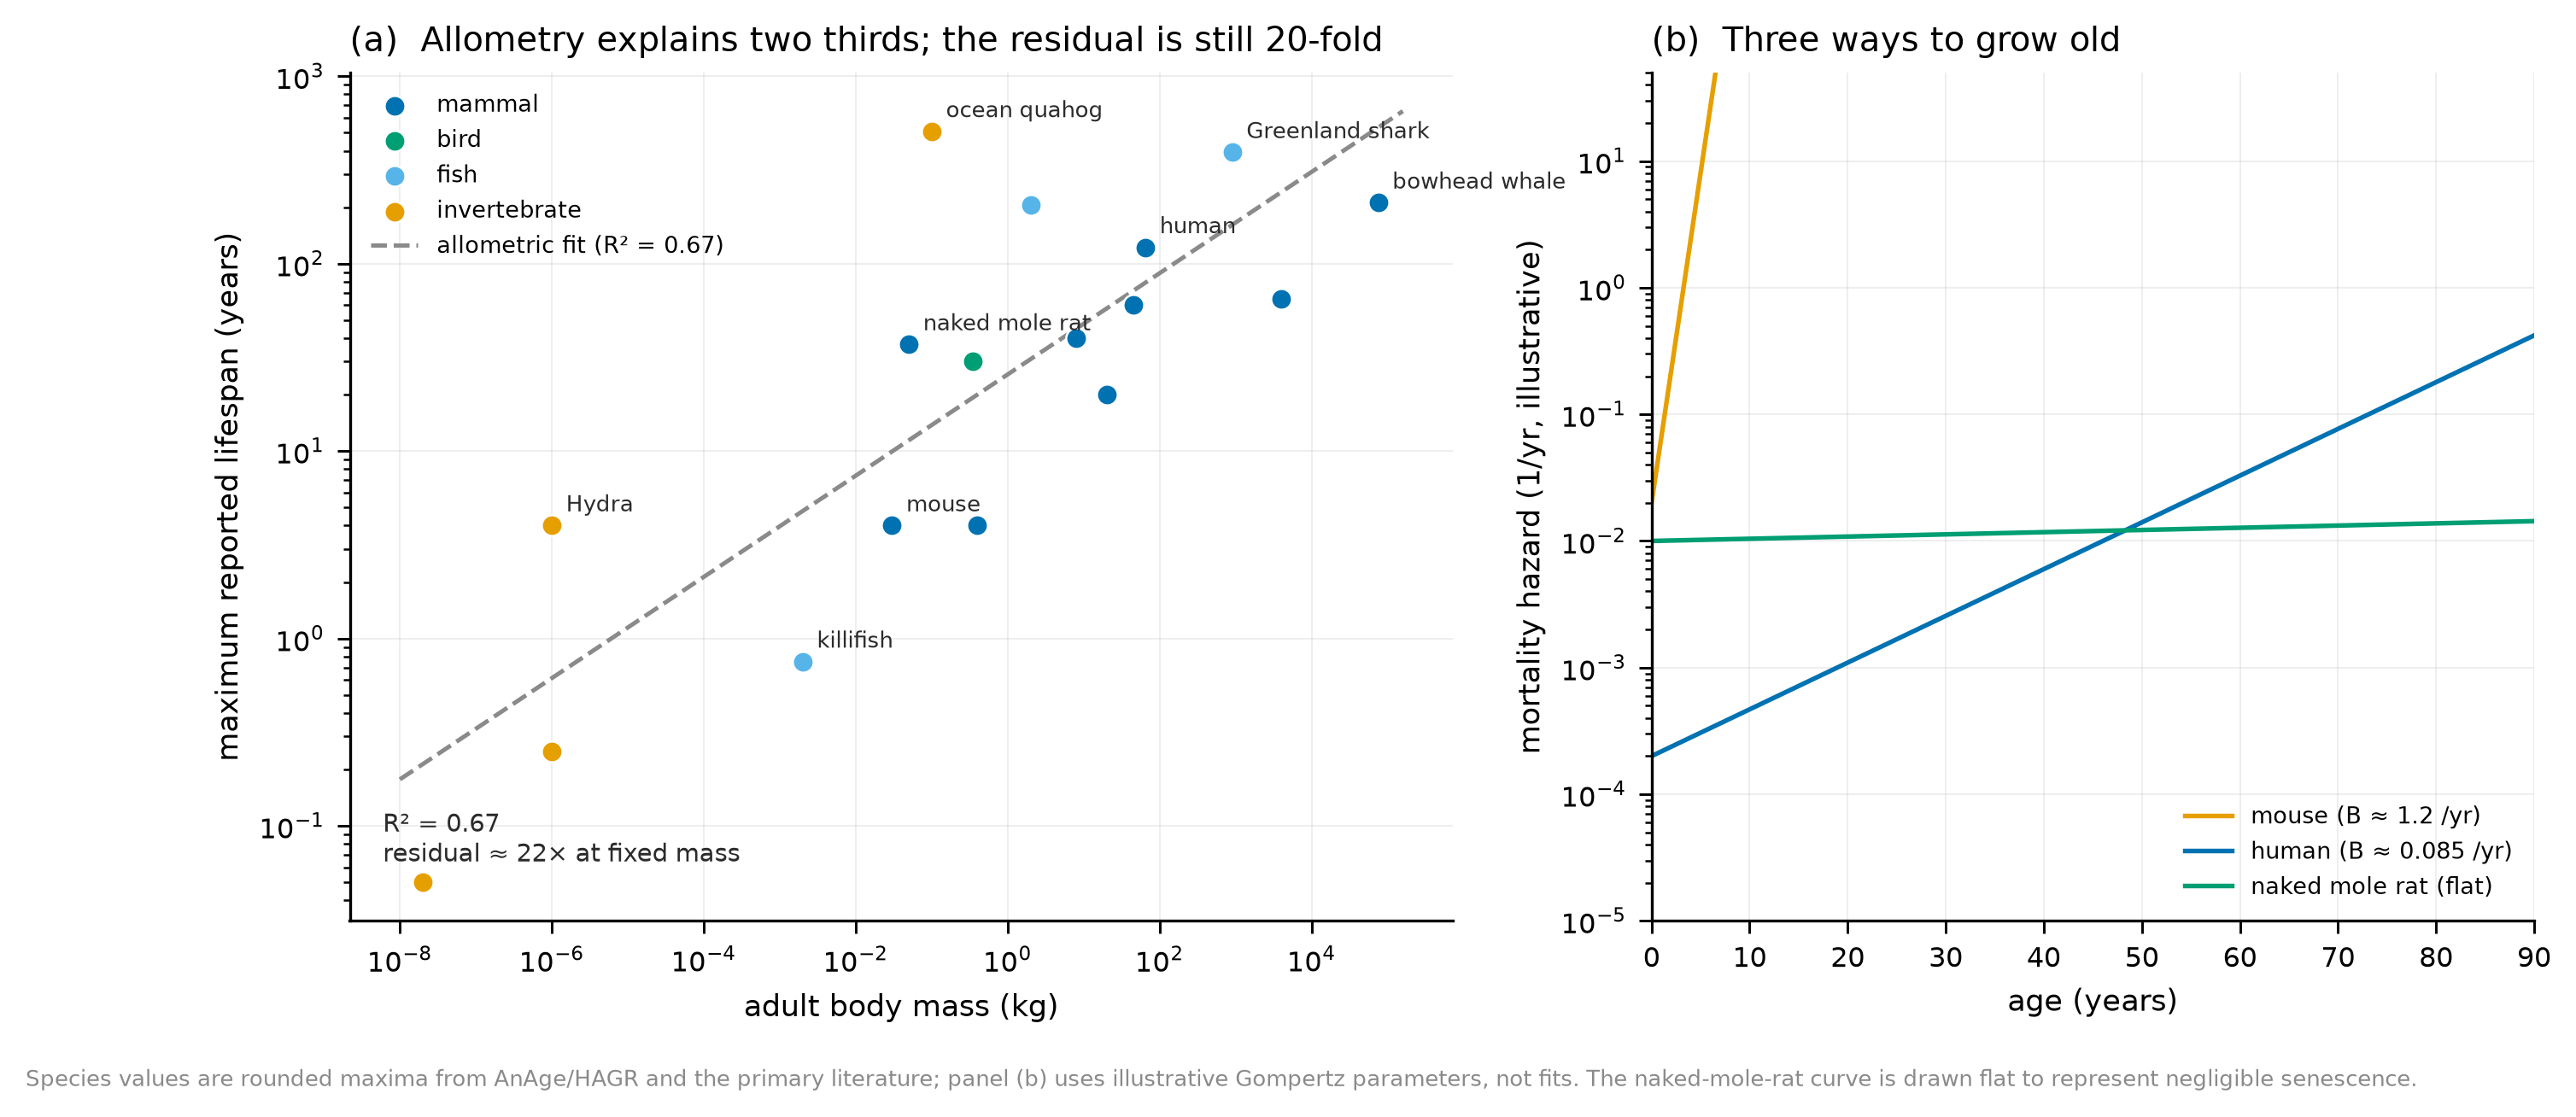
这三条理论都容易被写成宿命论,所以必须说清楚:它们预测的是衰老速度的多样性,不是”每个物种注定在某个年龄死亡”。裸鼹鼠的死亡率随年龄几乎不上升,某些鲸类可以活两百年,北极蛤的年龄环数超过五百年;同一种体重下,寿命可以差二十倍。图 2 用 17 个物种说明这一点:体型确实能解释一部分(对数—对数回归的 \(R^2\) = 0.67,斜率 0.27),但在固定体重上,寿命的残差仍有约 22 倍。换句话说,体型解释的是背景,维护策略解释的是差异。
All three theories are easily turned into fatalism, so state the claim precisely: they predict variation in the rate of ageing, not a fixed expiry date for each species. Naked mole rats show almost no rise in mortality with age; some whales live two centuries; ocean quahogs exceed five. At a given body mass, lifespan can differ twentyfold. Figure 2 makes the point with 17 species: size explains a real part (log–log \(R^2\) = 0.67, slope 0.27), but at fixed mass the residual spread is still about 22-fold. In other words, size explains the background; maintenance strategy explains the differences.
为了把”取舍”从比喻变成可计算的东西,我写了一个 Leslie 矩阵模型(脚本 03_evolution.py)。个体携带一个可遗传的维护投入 \(m\in[0,1]\):它让 Gompertz 衰老斜率按 \(B(m)=B_0(1-m)\) 下降,同时以二次成本降低繁殖力 \(F(m)=F_0(1-cm^2)\)。对外源死亡率 \(\mu_e\) 从 0.005 到 0.79 每年做扫描,取使种群内禀增长率最大的 \(m\)。模型结果是:安全环境(\(\mu_e\) 小)选择 \(m^*\) = 0.61,危险环境选择 0.30;对应的衰老斜率相差 1.81 倍。图 3 的右面板把结果画成风险曲线:高外源死亡率下的个体,即使”选择”了较少维护,其内在死亡率也上升得更快。
To turn the trade-off from metaphor into arithmetic, I wrote a Leslie-matrix model (03_evolution.py). An individual carries a heritable maintenance investment \(m\in[0,1]\) that slows the Gompertz slope, \(B(m)=B_0(1-m)\), at a quadratic fecundity cost \(F(m)=F_0(1-cm^2)\). Scanning extrinsic mortality \(\mu_e\) from 0.005 to 0.79 per year, I take the \(m\) that maximises the intrinsic growth rate. Model output: safe environments select \(m^*\) = 0.61, dangerous ones 0.30; the senescence slopes differ by 1.81-fold. The right panel of Figure 3 shows the resulting hazards: under high extrinsic mortality the organism senesces faster even after “choosing” less maintenance.
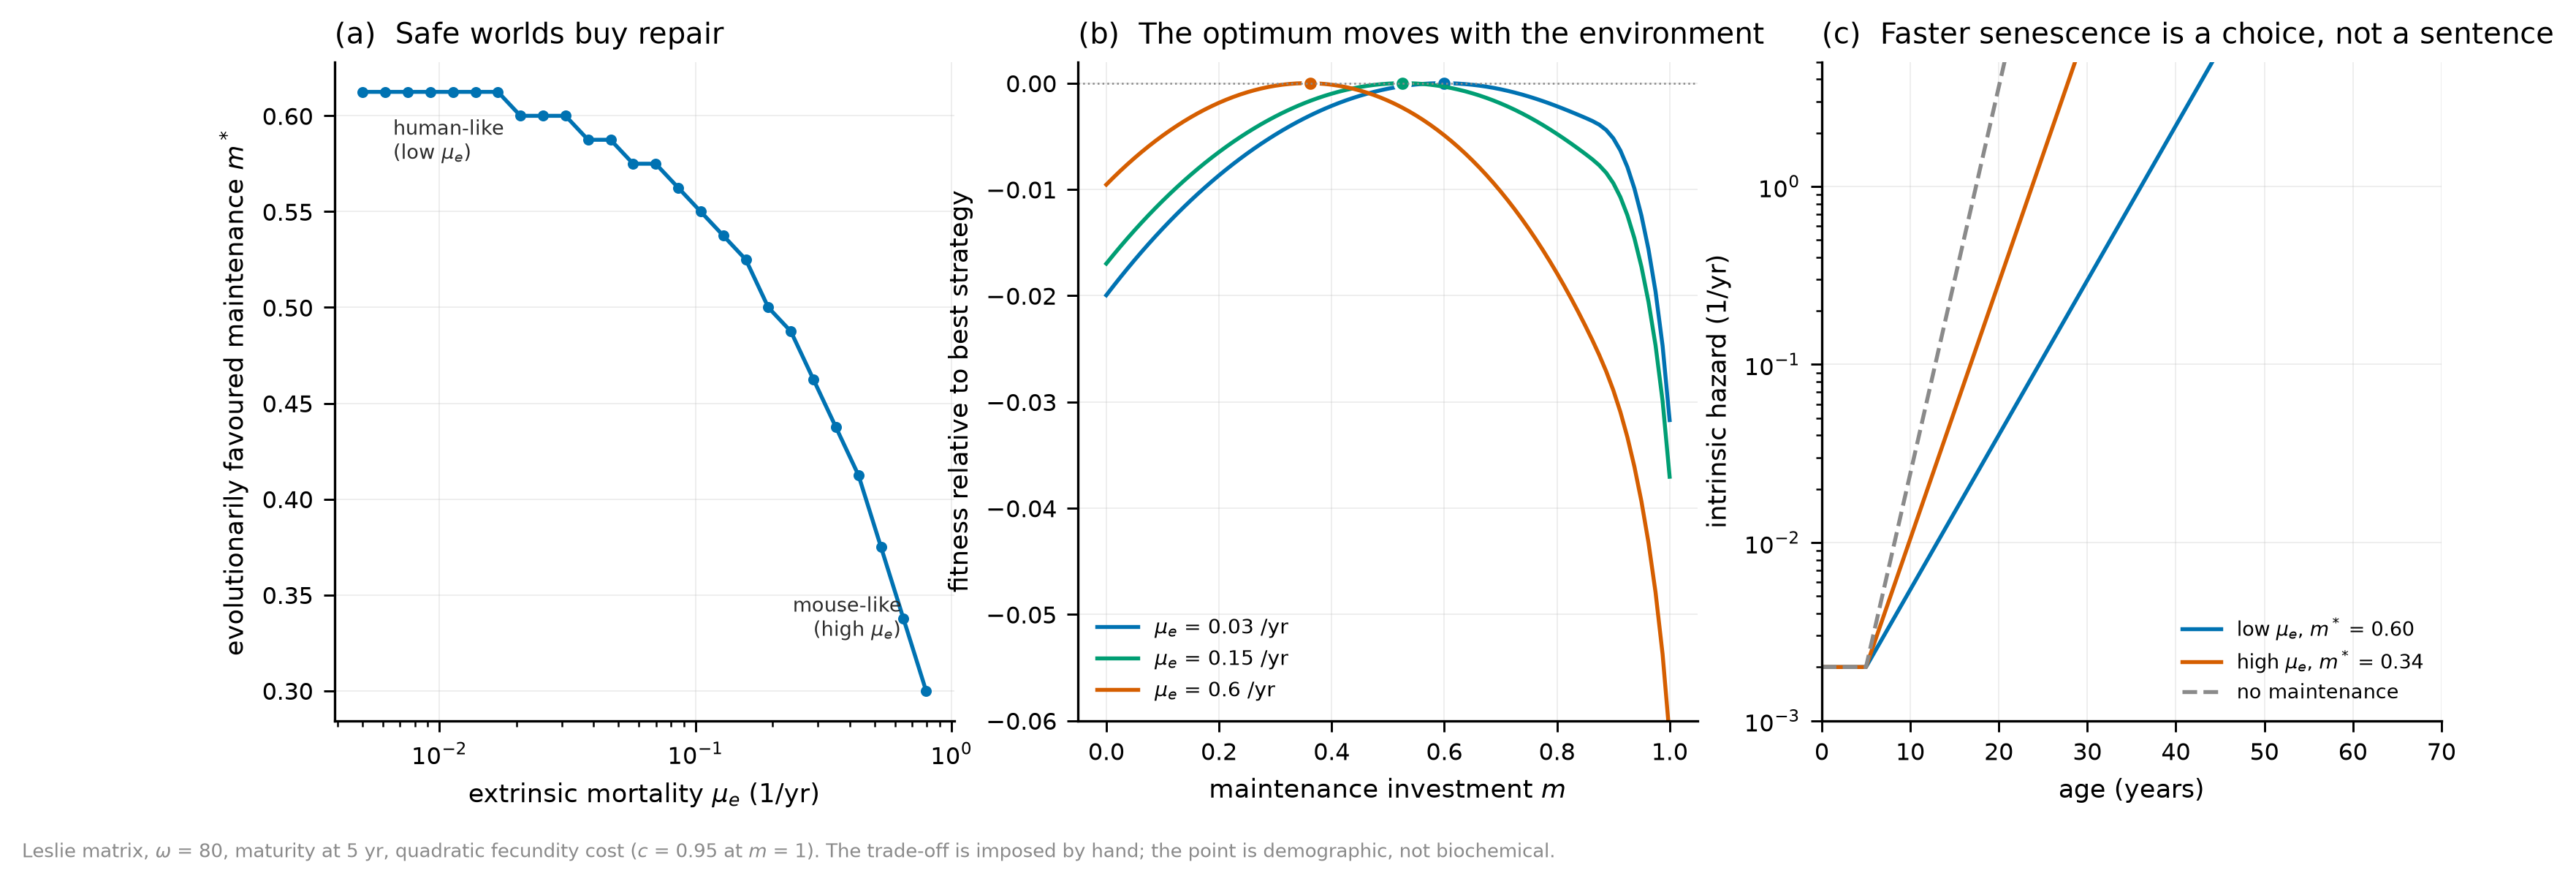
这里必须插入一个限制条件:模型里的”维护”是一维的,现实中的维护包括 DNA 修复、蛋白降解、免疫监视、干细胞补充,彼此并不共享同一个成本函数。因此图 3 证明的是方向——外源风险高的环境不会投资长期维护——而不是某个物种的具体寿命。它也给后面的讨论定了一个基调:如果衰老是取舍的结果,那么”逆转衰老”就不是修一个坏掉的零件,而是同时改变许多个被进化固定在特定水平的参数,并且要承担这些参数原本被选择所平衡掉的代价。
A limitation belongs here: maintenance in the model is one-dimensional, whereas real maintenance includes DNA repair, proteostasis, immune surveillance and stem-cell replenishment, which do not share a single cost function. Figure 3 therefore establishes a direction — high extrinsic risk does not favour long-term maintenance — not the lifespan of any species. It also sets the tone for what follows: if ageing is a trade-off, then “reversing ageing” is not fixing a broken part but changing many parameters that evolution has pinned at particular levels, while paying the costs that selection had balanced away.
3. 什么是衰老?我们究竟要逆转什么? / What is ageing, and what exactly are we reversing?
2023 年,López-Otín 与同事把 2013 年的九项衰老标志扩展为十二项,分成三组:原发性的基因组不稳定、端粒损耗、表观遗传改变、蛋白稳态丧失、巨自噬失能;拮抗性的营养感知失调、线粒体功能障碍、细胞衰老;整合性的干细胞耗竭、细胞间通信改变、慢性炎症、菌群失调。这个框架之所以有用,是因为它把”衰老”从一个名词拆成了一组可测量的过程;它之所以危险,是因为一份清单很容易被读成”十二个开关,逐个关掉就行”。
In 2023, López-Otín and colleagues expanded the nine hallmarks of ageing into twelve, in three groups: primary genomic instability, telomere attrition, epigenetic alterations, loss of proteostasis and disabled macroautophagy; antagonistic deregulated nutrient sensing, mitochondrial dysfunction and cellular senescence; integrative stem-cell exhaustion, altered intercellular communication, chronic inflammation and dysbiosis. The framework is useful because it turns “ageing” from a noun into a set of measurable processes. It is dangerous because a list is easily read as “twelve switches; turn each off”.
我把这十二项画成一张有向网络(图 4),并给每条边标了证据类型:因果(有扰动实验支持方向)、相关(随年龄或干预共同变化)、假说(机制上合理但尚未在体内证明)。在 34 条边里,25 条是因果(73.5%),7 条相关,2 条只是假说。度最高的四个节点是慢性炎症(10 条边)、细胞衰老(9)、干细胞耗竭(8)与细胞间通信(6)——三个属于”整合性”组。
I drew the twelve as a directed network (Figure 4) and labelled each edge by evidence type: causal (a perturbation supports the direction), correlative (co-varies with age or intervention), hypothetical (plausible but not yet shown in vivo). Of 34 edges, 25 are causal (73.5%), 7 correlative and 2 merely hypothetical. The four highest-degree nodes are chronic inflammation (10 edges), cellular senescence (9), stem-cell exhaustion (8) and altered intercellular communication (6) — three of them in the integrative group.
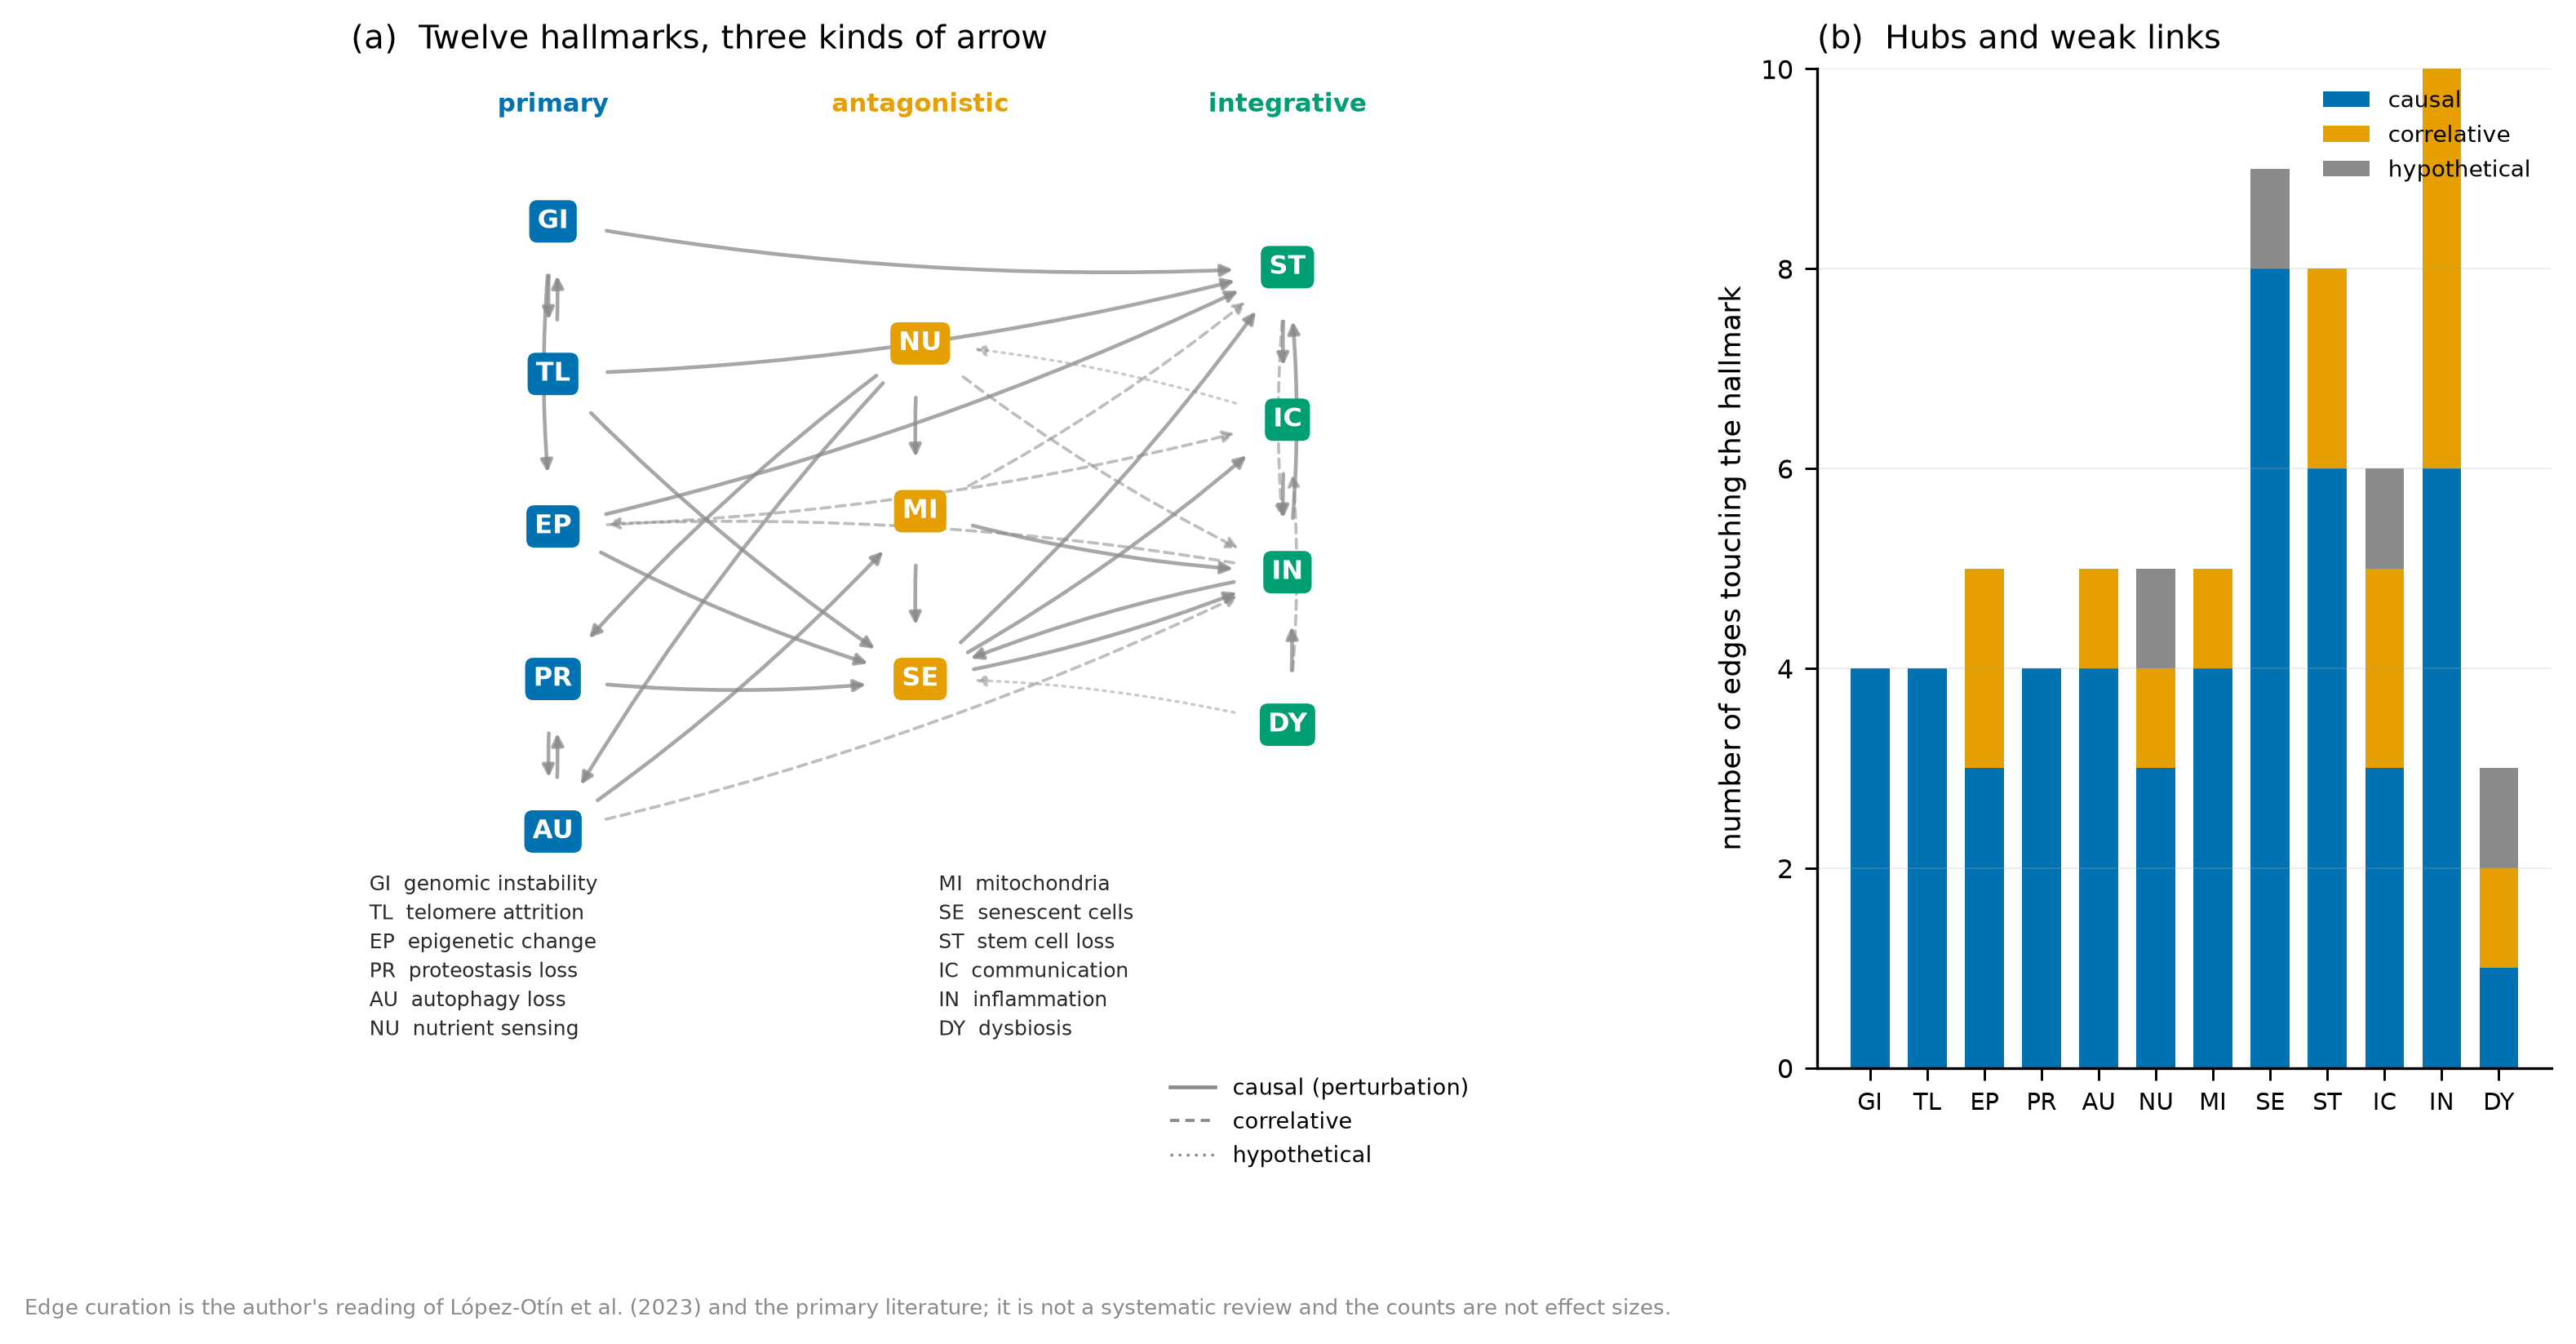
这张图最重要的信息不是”哪个是总开关”,而是没有总开关。炎症的度最高,但它既被衰老细胞驱动,又驱动干细胞耗竭;它是一个放大器,不是一个起点。端粒是另一个常被误用的例子:端粒损耗确实是原发标志之一,但端粒长度在人类不同组织中的预测力差异很大,端粒酶激活在小鼠中延长寿命的同时也增加肿瘤风险(Blasco 等,1997),而”端粒延长”既不是所有细胞恢复年轻功能的必要条件,也不能解释线粒体、蛋白稳态与细胞外基质的变化。把十二项中的某一项当成”衰老本身”,在生物学上等价于把发烧当成感染本身。
The most important message in the figure is not “which is the master switch” but there is none. Inflammation has the highest degree, but it is both driven by senescent cells and a driver of stem-cell exhaustion: an amplifier, not an origin. Telomeres are another commonly misused example. Telomere attrition is a primary hallmark, yet telomere length predicts outcomes very differently across human tissues; telomerase activation extends lifespan in mice while increasing tumour risk (Blasco et al., 1997); and “telomere extension” is neither necessary for every cell to recover young function nor an explanation for mitochondrial, proteostatic or extracellular-matrix changes. Treating one of the twelve as “ageing itself” is biologically equivalent to treating fever as the infection.
细胞衰老是另一个值得细看例子。用遗传或药物手段清除衰老细胞,在小鼠中确实能改善多个组织的功能、延长健康寿命,这是过去十年最扎实的因果证据之一;senolytics 的人体试验也确实降低了脂肪组织中的衰老细胞标志物。但同一批人体试验在硬终点上并不一致:有的在骨代谢的次要终点上看到信号,有的在随机对照的主要终点上没有差异。实验证据支持”衰老细胞是因果链条上的一环”,却不支持”清除衰老细胞就等于逆转衰老”。这两个命题之间的距离,正好是本文反复要量的那种距离。
Cellular senescence is worth a closer look. Genetic or pharmacological clearance of senescent cells improves function in several mouse tissues and extends healthspan — among the most solid causal results of the past decade — and human senolytic trials do reduce senescent-cell markers in adipose tissue. But the same set of human trials is inconsistent on hard endpoints: some show signals on secondary bone-metabolism measures, others find no difference on a randomised primary endpoint. Experimental evidence supports “senescent cells are one link in a causal chain”; it does not support “clearing senescent cells equals reversing ageing”. The distance between those two propositions is exactly the kind this article keeps measuring.
所以第三节的结论是一个定义问题:我们要逆转的不是一个标量”年龄”,而是一个高维状态向量 \(X(t)\),它的分量包括基因组损伤、端粒状态、表观遗传状态、蛋白稳态、线粒体功能、细胞组成、组织结构与免疫状态。作者假说:任何只改变其中一个分量的干预,最多只能让这个向量在一个方向上移动;而”年轻”是向量整体落在一个低损伤、低方差、可恢复的区域,不是某一个坐标回到 20 岁。这句话听起来抽象,但第四、五、六节会把它变成可计算的模型,并给出一个不太乐观的结论。
So the conclusion of this section is a definition. What we want to reverse is not a scalar “age” but a high-dimensional state vector \(X(t)\) whose components include genomic damage, telomere state, epigenetic state, proteostasis, mitochondrial function, cell composition, tissue architecture and immune state. Author’s hypothesis: any intervention that changes one component can move the vector along one direction at most; “young” is the vector lying in a low-damage, low-variance, recoverable region, not one coordinate returning to 20. This sounds abstract, but Sections 4–6 turn it into computable models and reach a rather sober conclusion.
4. 把表观遗传时钟倒拨 30 年,人真的年轻了吗? / If a clock rewinds 30 years, is the person younger?
过去十年,生物年龄最成功的产品不是任何一种药,而是一族算法。Horvath 的泛组织甲基化时钟(2013)、Hannum 的血液时钟(2013)、Levine 的 PhenoAge(2018)、Lu 的 GrimAge(2019)、Belsky 的 DunedinPACE(2022),以及后来的单细胞时钟、转录组/蛋白组/代谢组时钟,都把一组分子测量压缩成一个以”年”为单位的数字。它们确实有用:在多项队列中,表观遗传年龄加速与全因死亡、心血管事件和多种疾病风险相关,DunedinPACE 还被设计成测量”衰老速度”而不是”衰老程度”。
The most successful product of the past decade of biological-age research is not a drug but a family of algorithms. Horvath’s pan-tissue methylation clock (2013), Hannum’s blood clock (2013), Levine’s PhenoAge (2018), Lu’s GrimAge (2019), Belsky’s DunedinPACE (2022), and later single-cell, transcriptomic, proteomic and metabolomic clocks all compress a panel of molecular measurements into one number in years. They are genuinely useful: across cohorts, epigenetic age acceleration is associated with all-cause mortality, cardiovascular events and many diseases, and DunedinPACE was designed to measure the pace of ageing rather than its level.
但”预测”与”机制”是两件事。一个时钟是在数据分布上拟合出来的函数;它学到的是”在这个队列里,这些 CpG 的甲基化模式与年龄/死亡风险共同变化”。这并不自动意味着改变这些 CpG 会改变衰老过程。Bell 等(2019)在综述里把这个问题拆成几层:训练样本的代表性、组织特异性、细胞组成混杂、以及最关键的——因果方向未知。2024 年,Ying 等用孟德尔随机化把 CpG 分成”损伤型”与”适应型”,构建了 DamAge 与 AdaptAge 两个时钟,发现既有 clock 并不富集在因果位点上;同一批 CpG,有的变化是损伤,有的变化是保护,统计模型无法区分。
But prediction and mechanism are different things. A clock is a function fitted to a data distribution; it learns that, in this cohort, these CpG patterns co-vary with age or mortality. That does not automatically mean changing those CpGs changes the ageing process. Bell et al. (2019) separate the problem into layers: representativeness of the training set, tissue specificity, cell-composition confounding, and, crucially, unknown causal direction. In 2024, Ying et al. used Mendelian randomisation to split CpGs into damaging and adaptive sets and built the DamAge and AdaptAge clocks, finding that existing clocks are not enriched for causal sites; among the same CpGs, some changes are damage and some are protection, and a statistical model cannot tell them apart.
为了把这件事说清楚,我构造了一个十维的”损伤状态”模型(脚本 05_clocks.py):每个分量随年龄按 \(1-e^{-k_i a}\) 上升,两个时钟分别用 20 个”甲基化特征”和 6 个”表型指标”做岭回归,训练集 4,000 个模拟个体。两个时钟的预测误差分别是 3.6 岁与 3.4 岁——在训练分布内都算不错。然后我在 70 岁时做两类干预:一类真正把某一个损伤分量减半;另一类只沿着甲基化时钟读取的方向移动特征,状态本身不动。
To make this concrete, I built a ten-dimensional “damage state” model (05_clocks.py): each component rises with age as \(1-e^{-k_i a}\), and two clocks are ridge regressions on 20 methylation-like features and 6 phenotypic markers, trained on 4,000 simulated individuals. Their prediction errors are 3.6 and 3.4 years — respectable inside the training distribution. At age 70 I then apply two kinds of intervention: one truly halves a damage component; the other moves the methylation features along the direction the clock reads, leaving the state untouched.
模型结果:对十个真实的单分量干预,甲基化时钟每改善 1 个百分点的功能评分,平均回报约 1.3 年(范围 1.2–2.0 年);这说明在”状态真的变了”的情况下,时钟是个合理的代理。但对”只动甲基化”的干预,时钟报告年轻了 30 岁,功能评分改善 0.0%。图 5 的左上角那两个点就是这类情形:它们在图上的位置不是错误,而是逻辑上允许的——一个预测器可以被喂进它从未见过的输入。
Model output: for the ten genuine single-component interventions, the methylation clock returns about 1.3 years per percentage point of functional improvement (range 1.2–2.0), so when the state really changes, the clock is a reasonable proxy. But for the “methylation-only” intervention the clock reports 30 years younger while function improves by 0.0%. The two points in the upper-left of Figure 5 are not errors; they are logically permitted — a predictor can be fed inputs it has never seen.
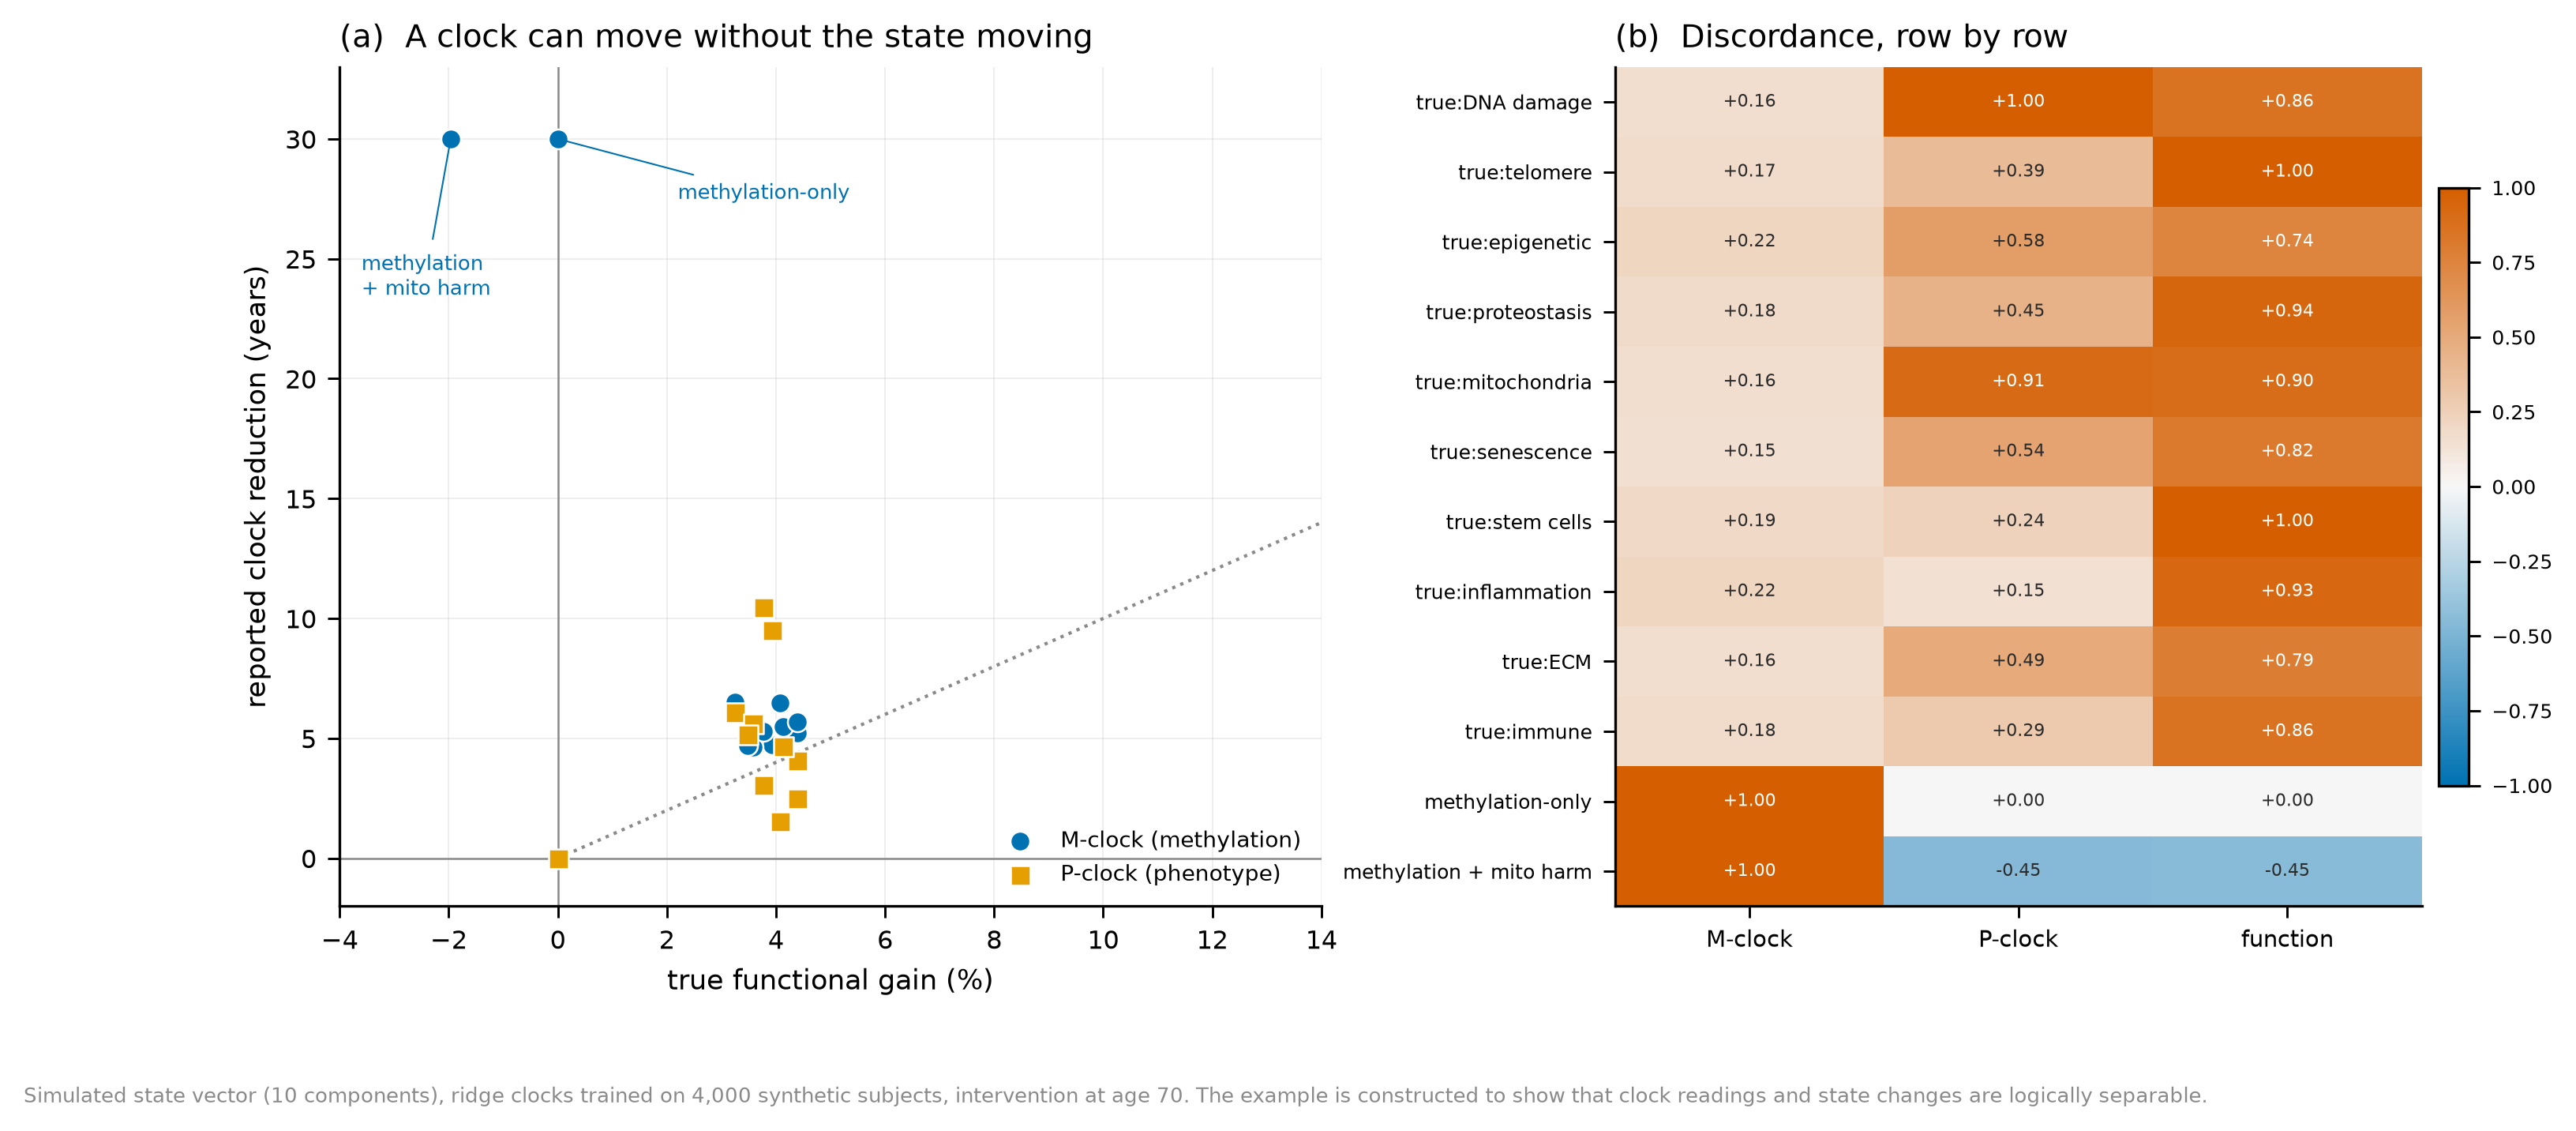
这不是说表观遗传时钟没用。它是目前最好的风险分层工具之一,在临床试验里可以作为辅助终点,帮助判断”某个干预是否至少改变了它声称改变的分子层”。问题出在把”时钟变年轻”直接当成”人变年轻”。数学命题(在这里是一个几乎平凡的事实):设真实状态为 \(x\),时钟为 \(g(z)\),其中 \(z=h(x)+\eta\);只要 \(h\) 不是单射,就存在 \(x\neq x'\) 使 \(g(h(x))=g(h(x'))\)。换句话说,任何低维读数都必然把不同的状态压到同一个数字上。要证明”人年轻了”,需要证明的是 \(x\) 回到了年轻区域,而不是 \(g\) 的输出变小。
This does not make epigenetic clocks useless. They are among the best risk-stratification tools we have, and in trials they can serve as supportive endpoints, helping to check whether an intervention at least changes the molecular layer it claims to change. The problem is equating “the clock is younger” with “the person is younger”. Mathematical proposition (here almost trivial): let the true state be \(x\) and the clock be \(g(z)\) with \(z=h(x)+\eta\); whenever \(h\) is not injective there exist \(x\neq x'\) with \(g(h(x))=g(h(x'))\). Any low-dimensional readout must collapse distinct states onto the same number. To show that a person is younger, one must show that \(x\) has returned to the young region, not that \(g\) became smaller.
一个具体的例子是 CALERIE 试验:两年热量限制在人体中改善了多项代谢与炎症指标,也改变了部分衰老时钟的读数,但没有、也不可能证明”健康寿命被延长”。这不是试验设计的失败,而是终点的时间尺度问题——要证明健康寿命,需要十年以上的随访与硬终点。另一个方向的问题是,某些急性状态(严重感染、手术、妊娠)也会在数周内改变甲基化年龄,而这些变化显然不是”返老还童”。作者假说:把时钟当作”分子层是否被触及”的指示灯是合理的,把它当作”整体状态是否回春”的判决书则越界了。
A concrete case is the CALERIE trial: two years of caloric restriction improved several metabolic and inflammatory markers in humans and changed some clock readings, but did not — and could not — show that healthspan was extended. That is not a design failure; it is a question of endpoint timescale, since demonstrating healthspan requires a decade or more of follow-up and hard endpoints. The opposite problem also exists: acute states such as severe infection, surgery or pregnancy can shift methylation age within weeks, and those shifts are plainly not rejuvenation. Author’s hypothesis: using a clock as an indicator of “has the molecular layer been touched” is reasonable; using it as a verdict on “has the whole state become young” is overreach.
5. 返老还童是一项多目标系统工程 / Rejuvenation is a multi-objective control problem
如果衰老是一个高维向量,那么”只修一项”会发生什么?我写了一个八维耦合常微分方程模型(脚本 06_multidim.py):每个分量 \(x_i\) 以速率 \(a_i\) 向 1 累积,干预 \(u_i\) 以速率 \(b_i u_i x_i\) 修复,分量之间还有有向耦合(线粒体→端粒、衰老细胞→炎症、炎症→干细胞,等等)。综合评分 \(S=1-\frac{1}{8}\sum x_i\) 是人为定义的,只用于在同一模型内比较策略,不代表生物年龄。
If ageing is a high-dimensional vector, what happens when you fix only one thing? I wrote an eight-dimensional coupled ODE model (06_multidim.py): each component \(x_i\) accumulates toward 1 at rate \(a_i\), an intervention \(u_i\) repairs it at rate \(b_i u_i x_i\), and components are coupled directionally (mitochondria→telomeres, senescent cells→inflammation, inflammation→stem cells, and so on). The composite score \(S=1-\frac{1}{8}\sum x_i\) is arbitrary, used only to compare strategies inside this model; it is not a biological age.
我比较了五种策略:只修端粒、只修表观遗传、只修线粒体、四项同时修、以及四项同时修再加一个带增殖代价的 senolytic。干预从 40 岁持续到 60 岁,然后停止,一直模拟到 100 岁。模型结果:对照在 60 岁时评分 0.205,四项联合在治疗期峰值 0.397,停止后回落到 0.147,反弹幅度 0.25;而只修端粒与只修表观遗传的终值分别是 0.088 与 0.083,都低于联合策略,但也都高于对照。
I compared five strategies: telomere-only, epigenetic-only, mitochondrial-only, four-way, and four-way plus a senolytic with a proliferative cost. Treatment runs from age 40 to 60 and then stops; the simulation continues to 100. Model output: the control scores 0.205 at 60; the four-way strategy peaks at 0.397 during treatment, falls to 0.147 after stopping, a relapse of 0.25. Telomere-only and epigenetic-only end at 0.088 and 0.083, both below the combined strategy but both above the control.
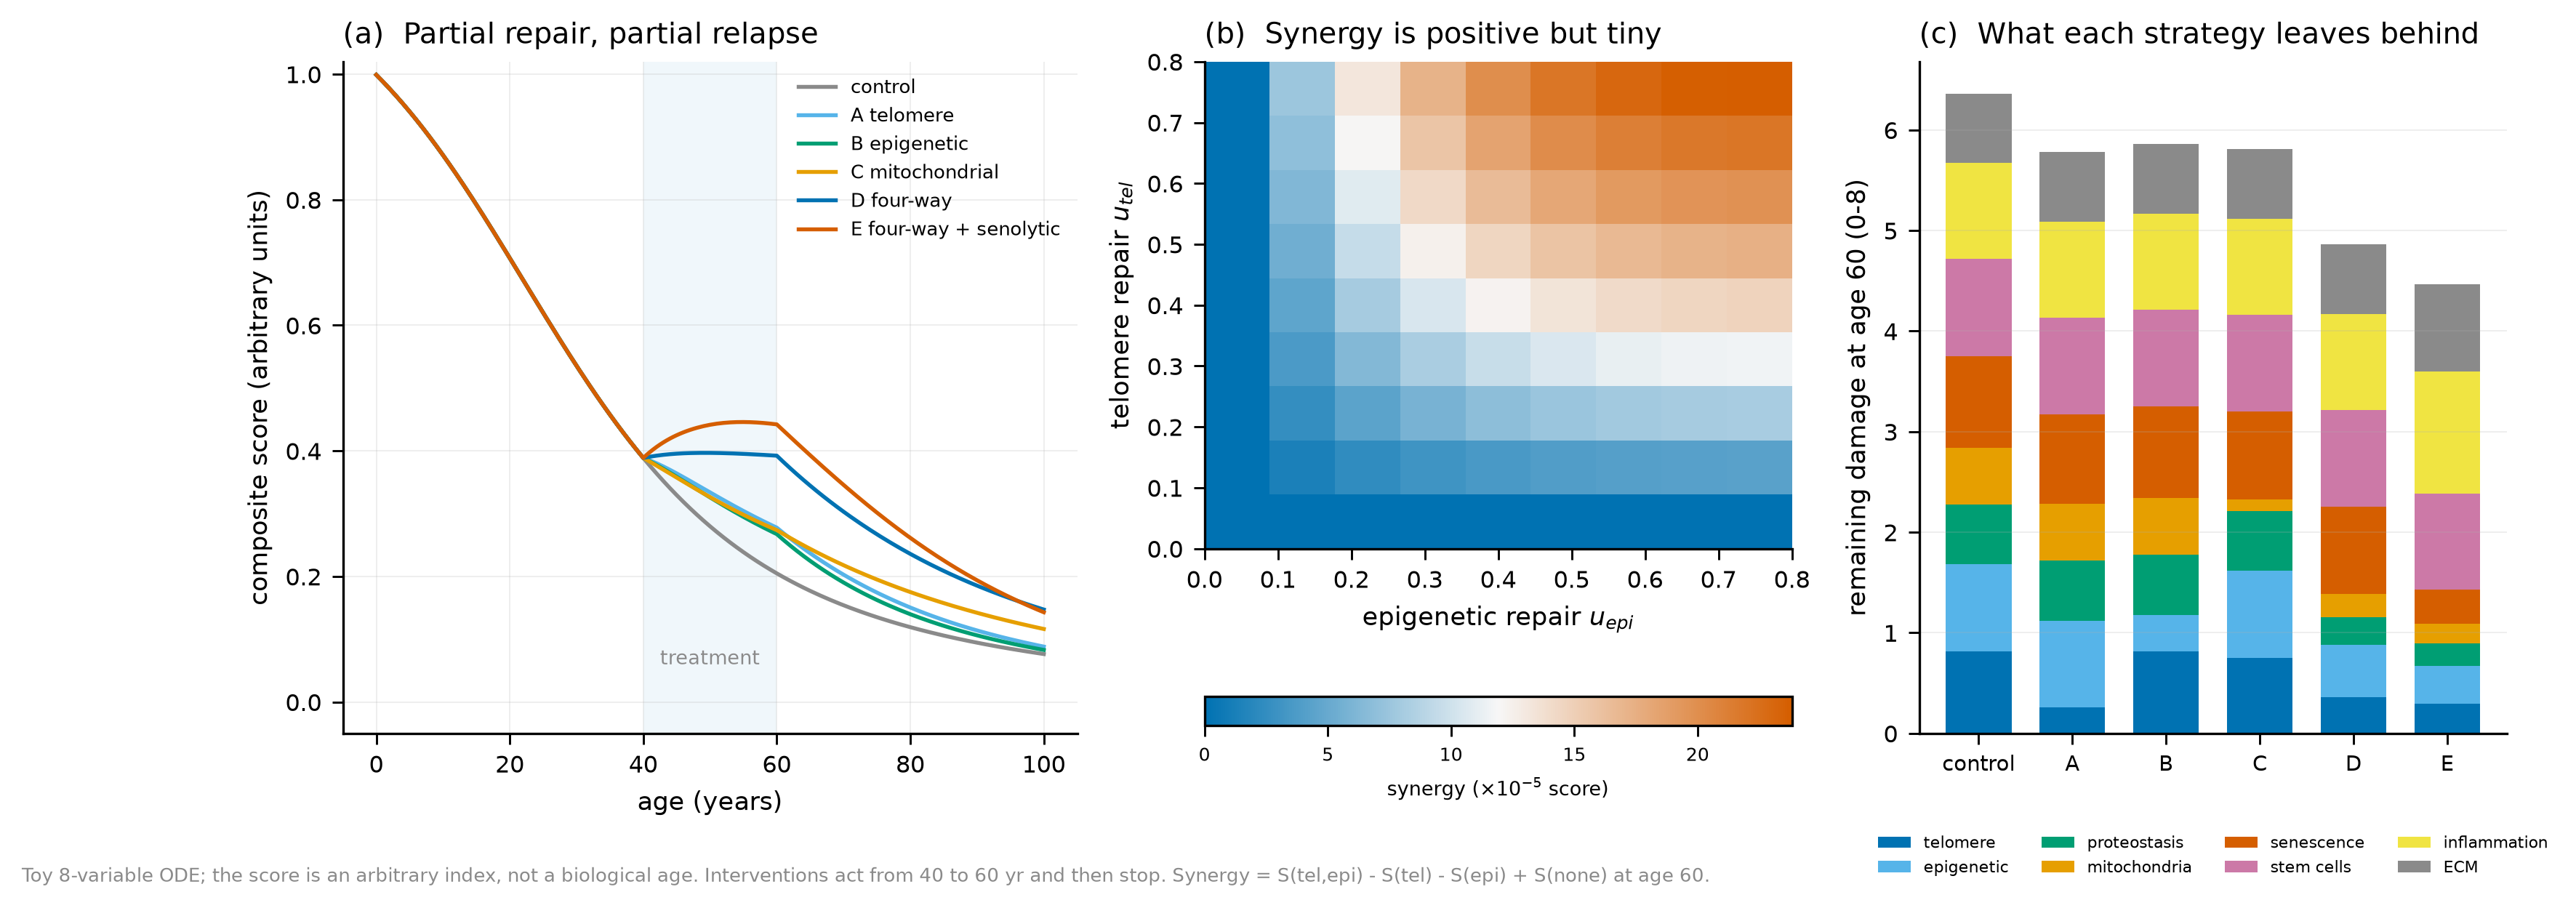
三个结论值得记住。第一,反弹是结构性的:治疗停止后,未被修复的分量继续按 \(a_i\) 累积,并通过耦合把已经修好的分量重新拉坏;在模型里,联合策略治疗后的状态是稳定的(Jacobian 最大实部 -0.0296 < 0),但”稳定”不等于”不回退”,它只是一个有外部输入的稳态。第二,协同很小:端粒与表观遗传同时修,带来的额外收益只有 10⁻⁵ 量级,说明线性叠加已经是这个模型里的主旋律。第三,没有任何单一策略能让所有分量归零;即使四项联合,60 岁时仍有一半以上的总分损伤残留。
Three conclusions are worth keeping. First, relapse is structural: after treatment stops, unrepaired components keep accumulating at \(a_i\) and drag repaired ones back through the couplings; the treated state is stable in the model (largest Jacobian real part -0.0296 < 0), but “stable” does not mean “no relapse” — it is a steady state that requires an external input. Second, synergy is tiny: repairing telomeres and epigenome together adds only a 10⁻⁵-level bonus, so linear addition is the rule in this model. Third, no single strategy drives every component to zero; even the four-way strategy leaves more than half of the total damage at 60.
这些数字当然依赖于我随手写的 \(a_i,b_i\) 与耦合矩阵。它们不应该被引用为”联合疗法只能恢复 15%“之类的结论。它们能支持的是一个较弱但更稳的判断:在多维耦合系统里,单点干预的效果会被未干预维度稀释,停止干预后会被动力学拉回。这与临床上”停药后指标回落”的直觉一致,也解释了为什么”一次治疗,永久年轻”在概念上就需要一个能改变 \(a_i\) 本身(而不只是提高 \(u_i\))的干预。
These numbers depend on the \(a_i\), \(b_i\) and coupling matrix I chose. They must not be quoted as “combination therapy restores only 15%”. What they support is weaker and more robust: in a coupled multi-dimensional system, a single-point intervention is diluted by the untouched dimensions and pulled back by the dynamics after it stops. This matches the clinical intuition of markers rebounding after a drug is stopped, and it explains why “one treatment, permanent youth” conceptually requires changing \(a_i\) itself, not just raising \(u_i\).
6. 细胞重编程:让细胞年轻,还是让细胞失去身份? / Reprogramming: younger cells, or cells that forgot what they are?
2006 年,Yamanaka 把四个转录因子(Oct4、Sox2、Klf4、c-Myc,合称 OSKM)导入成纤维细胞,得到了诱导多能干细胞。这项技术证明了一件深刻的事:分化状态是可逆的。2016 年,Ocampo 等把 OSKM 以周期性方式(2 天表达、5 天关闭)导入早衰小鼠,中位寿命延长约三分之一,同时多个组织的衰老标志改善;但持续表达会导致畸胎瘤。2022 年,Gill 等提出”成熟期短暂重编程”:在细胞尚未完全失去身份时停止,仍能获得部分年轻化。2024 年的一篇综述把这条路概括为”long and winding”,并列出身份丢失、基因组不稳定与肿瘤风险三道坎。
In 2006, Yamanaka introduced four transcription factors (Oct4, Sox2, Klf4, c-Myc; OSKM) into fibroblasts and obtained induced pluripotent stem cells. The result proved something deep: differentiation is reversible. In 2016, Ocampo et al. expressed OSKM cyclically (2 days on, 5 days off) in progeroid mice, extending median lifespan by about a third and improving ageing markers in several tissues; continuous expression produced teratomas. In 2022, Gill et al. proposed “maturation-phase transient reprogramming”: stopping before cells fully lose identity still yields partial rejuvenation. A 2024 review calls the road “long and winding” and lists three obstacles: identity loss, genomic instability and tumour risk.
截至 2026 年 11 月,人体证据仍然只到”局部、开放标签、安全性为主”的阶段。一项注册号为 NCT07290244 的 1 期研究,用 AAV 把 OSK(不含 c-Myc)递送到单眼视网膜神经节细胞,再用多西环素控制表达 56 天,计划入组 18 人,主要终点是安全性与耐受性。2026 年 10 月,申办方报告了最低剂量组 3 名受试者中 2 名在第 56 天视野检查有改善,没有剂量限制性毒性;这些是公司发布的、尚未经过同行评议的数据,样本极小,没有对照,也没有任何全身性证据。把它读成”人类返老还童已被证明”,是把 1 期安全性研究读成了 3 期疗效研究。
As of November 2026, human evidence remains local, open-label and safety-dominated. A phase 1 study registered as NCT07290244 delivers OSK (without c-Myc) by AAV to retinal ganglion cells in one eye, with doxycycline-controlled expression for 56 days; it plans to enrol 18 participants and its primary endpoint is safety and tolerability. In October 2026 the sponsor reported that 2 of 3 participants at the lowest dose showed visual-field improvements at day 56, with no dose-limiting toxicity. These are sponsor-reported, not peer-reviewed data, with a tiny sample, no control arm and no systemic evidence. Reading this as “human rejuvenation has been demonstrated” is reading a phase 1 safety study as a phase 3 efficacy study.
为了理解”安全窗”从何而来,我把重编程写成二维势能面上的运动(脚本 07_reprogram.py):横轴是年龄坐标 \(a\),纵轴是分化程度 \(d\),势能有三个井——年轻分化、年老分化、多能——中间有一道脊把年轻与多能隔开。重编程是一股短时的力,把 \(a\) 与 \(d\) 同时往下推;剂量太大或时间太长,细胞就越过脊线掉进多能井。模型结果:在扫描的 150 个”剂量×时长”条件里,61.3% 的条件是安全的(身份丢失比例低于 5%);低剂量短时程的身份丢失比例为 0.00,高剂量长时程为 1.00;在安全区内,最大的年龄坐标下降为 0.74(坐标单位,不是年)。
To understand where a safety window comes from, I modelled reprogramming as motion on a two-dimensional potential (07_reprogram.py): the horizontal axis is an age coordinate \(a\), the vertical axis differentiation \(d\), and the potential has three wells — young differentiated, old differentiated, pluripotent — with a ridge separating young from pluripotent. Reprogramming is a transient force pushing both \(a\) and \(d\) down; too much dose or duration carries a cell over the ridge into the pluripotent well. Model output: of the 150 dose-by-duration conditions scanned, 61.3% are safe (identity loss below 5%); identity loss is 0.00 at low dose and short duration, and 1.00 at high dose and long duration; inside the safe region the largest age-coordinate reduction is 0.74 (coordinate units, not years).
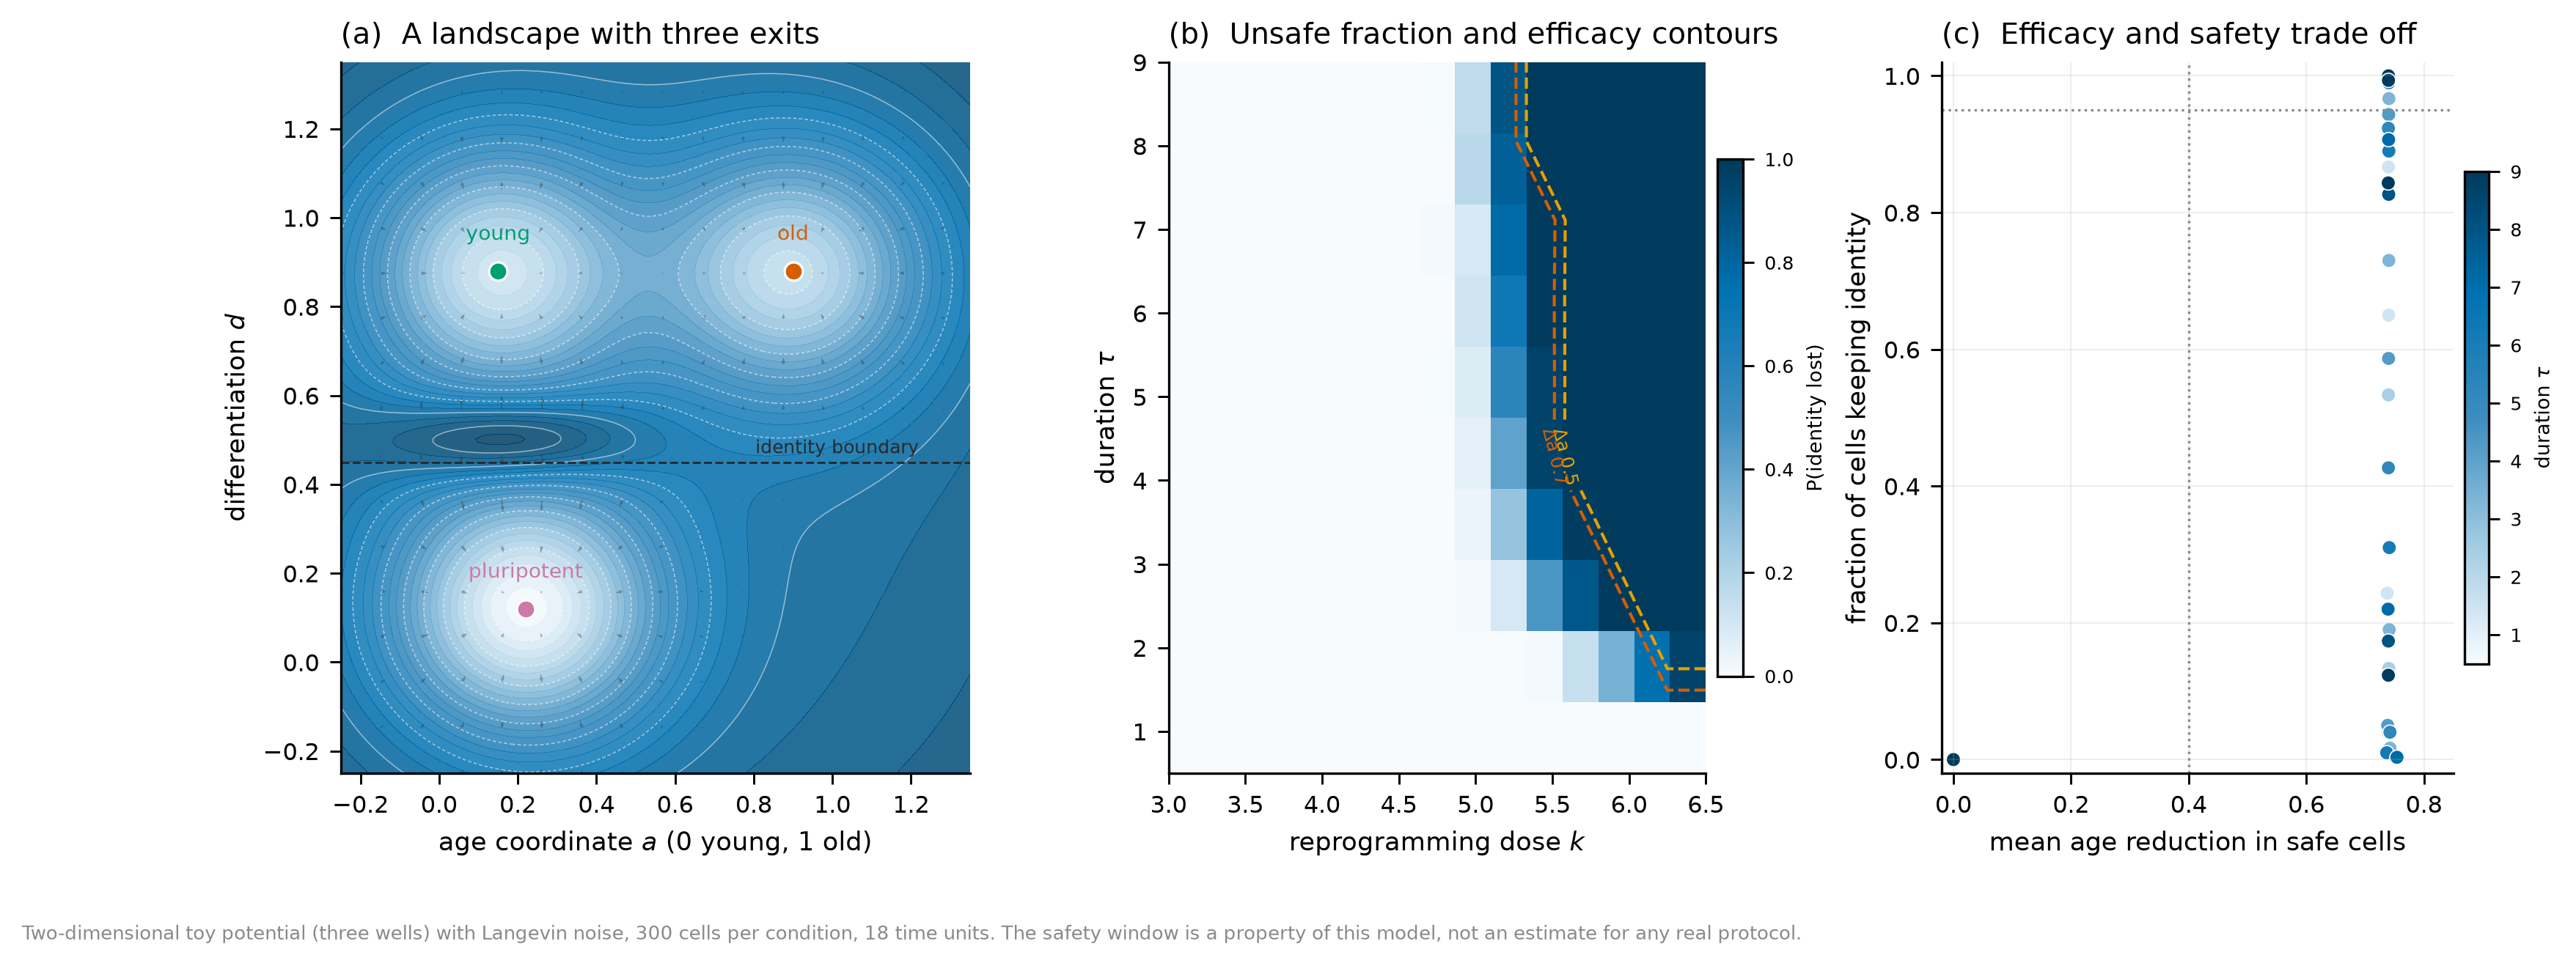
这张图想表达的不是”重编程一定致癌”,而是”风险是条件的函数”。Ocampo 的周期性方案之所以能避开畸胎瘤,是因为它在细胞越过某个点之前把因子撤掉;Gill 的成熟期方案也是如此。作者假说:真正决定安全性的不是”用不用 OSK”,而是三个可测量的量——每个细胞累积的暴露量、组织中对身份最敏感的细胞类型、以及停止后能否在合理时间内恢复成熟表型。这三个量都可以在体外和动物中测,也应该成为任何人体试验的入组前门槛,而不是等 1 期安全性数据出来再讨论。
The figure does not say “reprogramming always causes cancer”; it says “risk is a function of conditions”. Ocampo’s cyclic protocol avoided teratomas by withdrawing the factors before cells crossed a point, and Gill’s maturation-phase protocol does the same. Author’s hypothesis: what determines safety is not “OSK or not” but three measurable quantities — the cumulative exposure per cell, the cell type most sensitive to identity loss in each tissue, and whether a mature phenotype recovers within a reasonable time after stopping. All three can be measured in vitro and in animals, and they should be entry criteria for any human study rather than topics for discussion after phase 1.
7. 恢复再生能力,会不会同时增加癌症风险? / Does restoring regeneration raise cancer risk?
再生医学与抗衰老共享一个动作:让细胞多分裂。多分裂意味着多复制,多复制意味着更多突变。Armitage 与 Doll 在 1954 年提出的多阶段模型把癌变写成 \(m\) 个限速事件依次发生;如果每个事件的速率都与干细胞分裂率成正比,那么把分裂率提高 \(r\) 倍,癌症风险近似乘以 \(r^m\)。这个算术不需要任何新的生物学假设,只需要”突变随分裂累积”这一条。
Regenerative medicine and anti-ageing share one action: making cells divide more. More divisions mean more replication and more mutations. The multistage model of Armitage and Doll (1954) writes carcinogenesis as \(m\) rate-limiting events in sequence; if each event’s rate is proportional to the stem-cell division rate, then raising the division rate by \(r\) multiplies cancer risk by roughly \(r^m\). This arithmetic needs no new biology beyond “mutations accumulate with divisions”.
我用一个六阶段模型做了计算(脚本 08_cancer.py):把 85 岁前终生风险校准到 40%,其他死因用 Gompertz,然后改变再生强度 \(r\)。模型结果:\(r=1.3\) 时风险是基线的 2.29 倍,\(r=1.6\) 时是 2.50 倍;如果分裂率翻倍,风险乘数是 64。在”风险不超过基线两倍”的约束下,模型允许的最大 \(r\) 只有 1.20,对应的组织功能增益(一个启发式曲线,不是临床终点)约 15.4%。图 8 的蒙特卡洛与解析式一致:\(r=1\) 时 85 岁累计发病率 0.400,与 0.40 的设定相符。
I computed this with a six-stage model (08_cancer.py): lifetime risk to 85 is calibrated to 40%, other causes follow Gompertz, and regeneration intensity \(r\) is varied. Model output: at \(r=1.3\) the risk is 2.29 times baseline, at \(r=1.6\) it is 2.50 times; a doubling of division rate multiplies risk by 64. Under a “no more than twice baseline” constraint, the largest admissible \(r\) is only 1.20, with a heuristic tissue-function gain of about 15.4%. The Monte Carlo in Figure 8 matches the analytic curve: at \(r=1\) the cumulative incidence to 85 is 0.400, as calibrated.
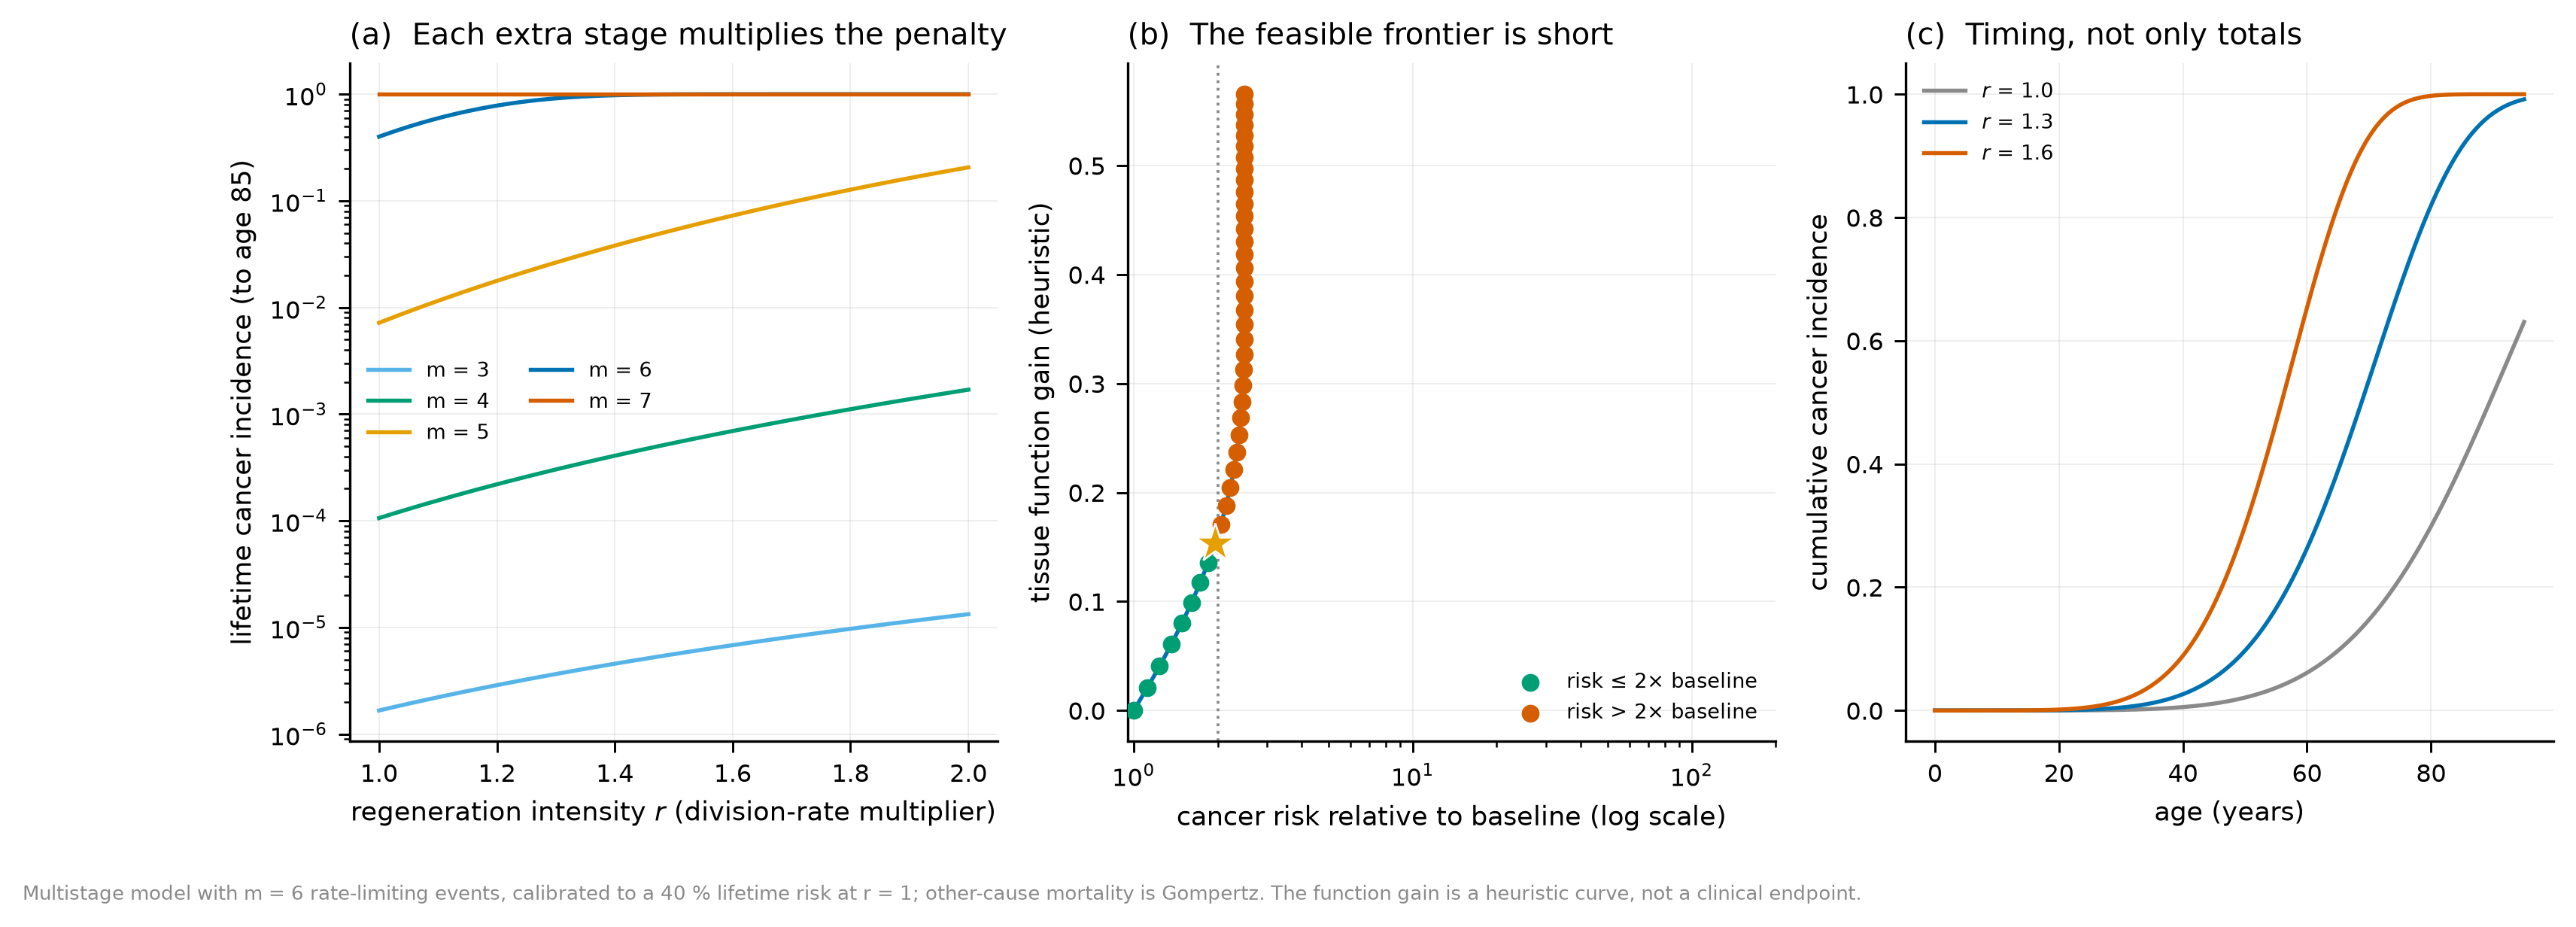
这个模型故意忽略了免疫监视。真实组织里,新出现的异常克隆会被 T 细胞与 NK 细胞清除,所以”多分裂必然多癌”并不成立;Tomasetti 与 Vogelstein(2015)的”干细胞分裂次数与癌症风险相关”也受到 Wu 等(2016)的反驳,后者强调外源风险因素的解释力。作者假说:再生疗法的净风险取决于三个可测量量的乘积——新增分裂次数、每次分裂的驱动突变概率、以及免疫清除效率;前两个可以压低,第三个可以被增强。把这三项都测出来,比争论”再生是否致癌”更有意义。
The model deliberately ignores immune surveillance. In real tissues, emerging abnormal clones are removed by T and NK cells, so “more divisions, therefore more cancer” does not follow automatically; Tomasetti and Vogelstein’s (2015) correlation between stem-cell divisions and cancer risk was countered by Wu et al. (2016), who emphasised the explanatory power of extrinsic risk factors. Author’s hypothesis: the net risk of a regenerative therapy is the product of three measurable quantities — the number of extra divisions, the driver-mutation probability per division, and immune clearance efficiency. The first two can be lowered and the third can be raised. Measuring all three is more useful than arguing about whether regeneration is carcinogenic.
8. 死亡风险能否真的归零? / Can the risk of death actually reach zero?
生存分析给了我们一套很成熟的工具:Gompertz 模型 \(\mu(t)=Ae^{Bt}\) 描述成年后指数上升的死亡风险,Makeham 加一个与年龄无关的常数项,Weibull 用幂律描述失效,竞争风险把多种死因叠加,多状态模型允许在健康、失能、死亡之间转移。这些工具的共同点是:它们描述的是风险,不是命运。
Survival analysis gives a mature toolkit: the Gompertz model \(\mu(t)=Ae^{Bt}\) for the exponential rise of adult mortality, Makeham adding an age-independent constant, Weibull for power-law failure, competing risks for multiple causes, and multistate models for transitions between health, disability and death. Their common feature: they describe risk, not destiny.
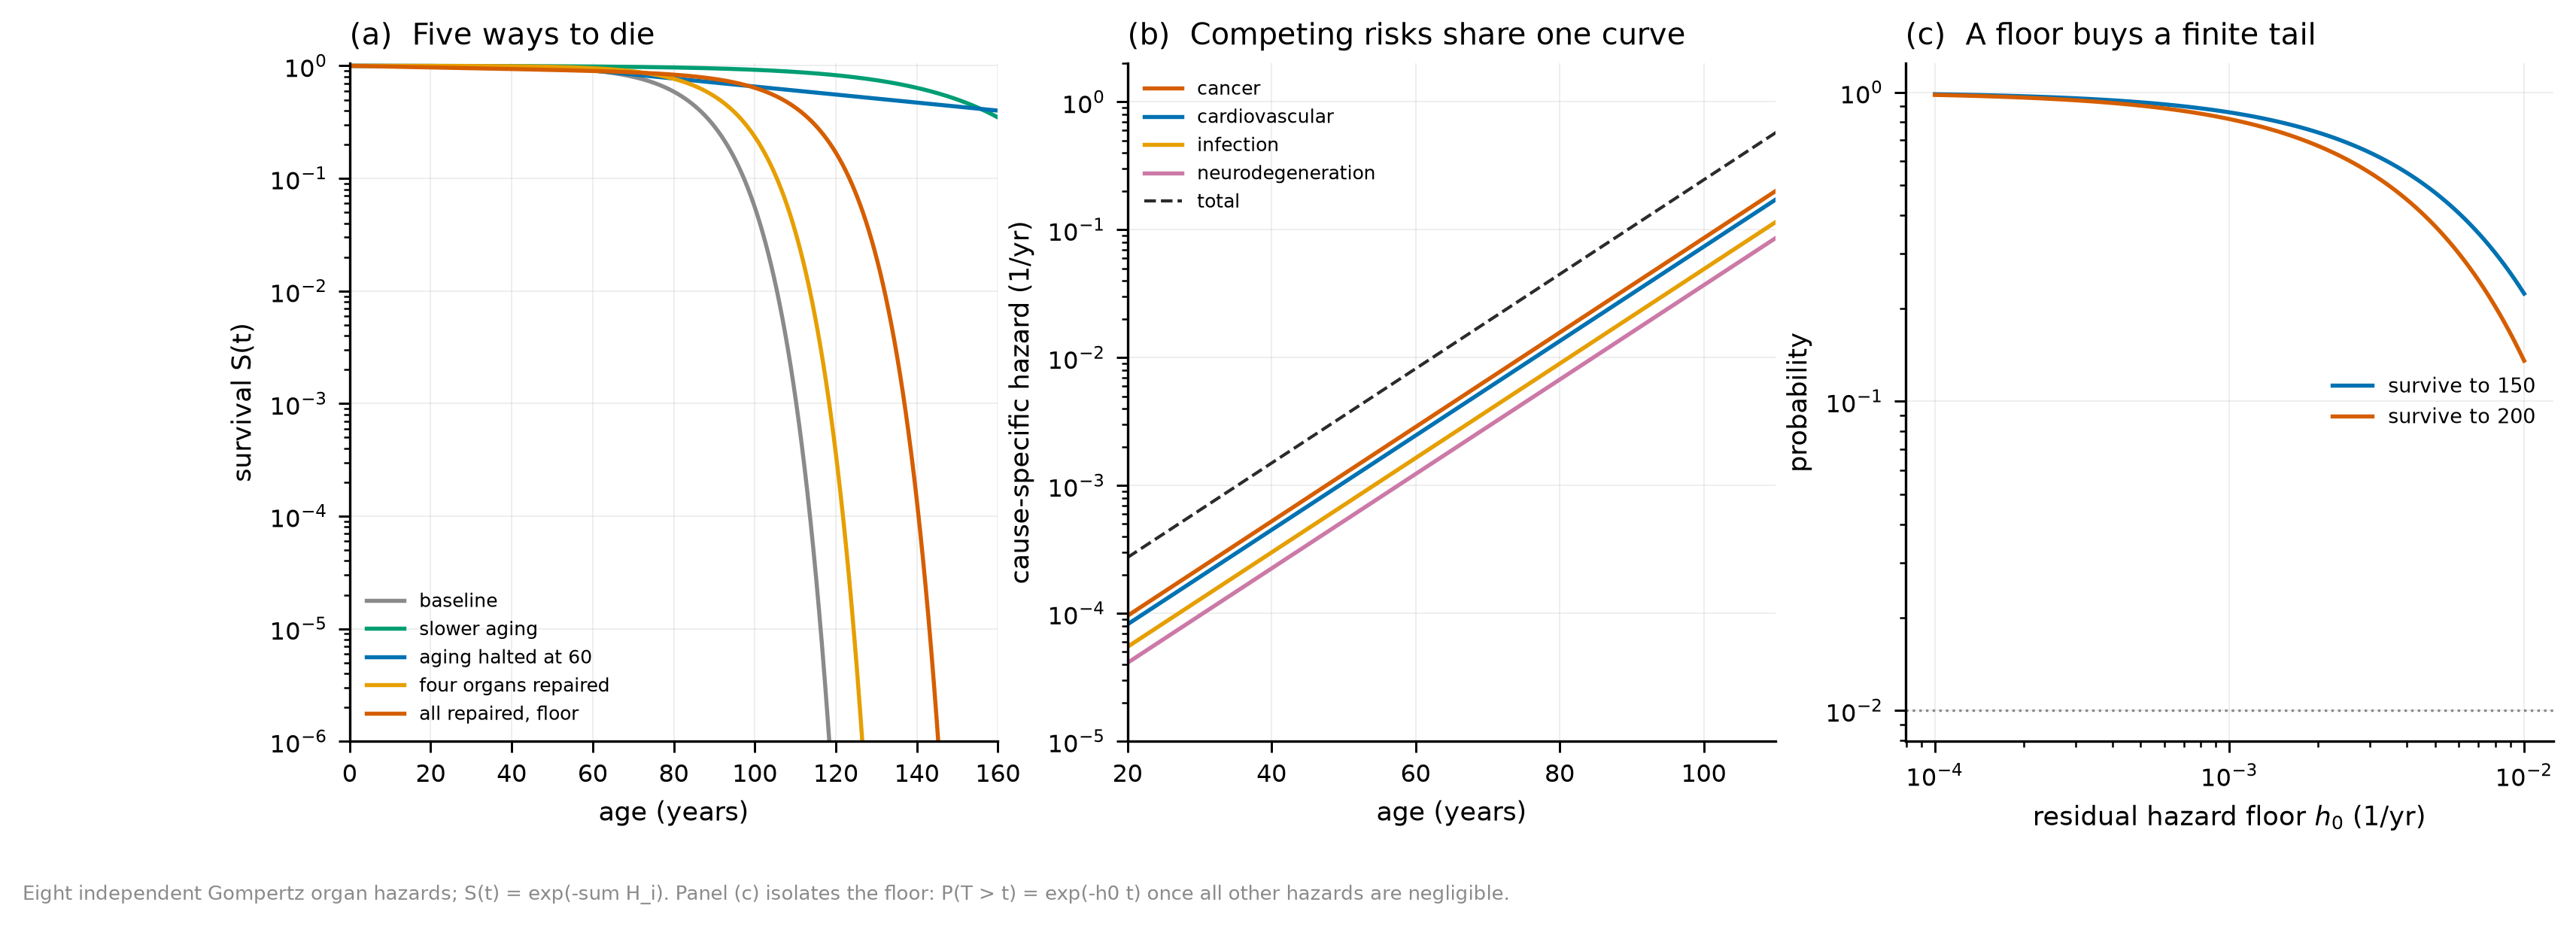
我构造了八个独立器官系统的 Gompertz 模型,死亡定义为任一系统失效,比较五种策略(脚本 09_survival.py)。模型结果:基线中位寿命 83.2 岁,衰老速度减半为 150.2 岁,60 岁冻结风险为 132.8 岁,修好八个中的四个为 91.4 岁,八个都修且保留残余风险下限为 107.0 岁。健康寿命(以 70% 队列仍未发生复合事件为界)在基线是 75.5 岁,在衰老减半下是 134.6 岁。
I built eight independent Gompertz organ systems, defined death as failure of any one, and compared five strategies (09_survival.py). Model output: median lifespan is 83.2 years at baseline, 150.2 with ageing halved, 132.8 with hazard frozen at 60, 91.4 with four of eight organs repaired, and 107.0 with all eight repaired but a residual hazard floor. Healthspan (70% of the cohort still free of the composite event) is 75.5 years at baseline and 134.6 under halved ageing.
这里有一个数学命题,它比任何模拟都硬:
设 \(T\) 为非负随机变量,风险函数 \(h(t)\),生存函数 \(S(t)=\exp(-\int_0^t h)\)。若存在 \(h_0>0\) 与 \(t_0\),使得对所有 \(t\ge t_0\) 有 \(h(t)\ge h_0\),则 \(S(t)\le e^{-h_0(t-t_0)}\),从而 \(\mathbb{P}(T=\infty)=0\),且 \(\mathbb{E}[T]<\infty\)。反之,若 \(\int_0^\infty h(t)\,dt<\infty\),则 \(\mathbb{P}(T=\infty)>0\)。
Here is a mathematical proposition harder than any simulation:
Let \(T\ge 0\) have hazard \(h(t)\) and survival \(S(t)=\exp(-\int_0^t h)\). If there exist \(h_0>0\) and \(t_0\) such that \(h(t)\ge h_0\) for all \(t\ge t_0\), then \(S(t)\le e^{-h_0(t-t_0)}\), hence \(\mathbb{P}(T=\infty)=0\) and \(\mathbb{E}[T]<\infty\). Conversely, if \(\int_0^\infty h(t)\,dt<\infty\), then \(\mathbb{P}(T=\infty)>0\).
证明只有两行:\(S(t)=\exp(-\int_0^t h)\le\exp(-\int_{t_0}^t h)\le e^{-h_0(t-t_0)}\),令 \(t\to\infty\) 即得。反向情形同理,\(\int h<\infty\) 意味着 \(S(\infty)>0\)。这个命题说明:“死亡风险归零”不是把风险压得很低,而是要求风险在某个尺度上可积;任何正的下限,无论多小,都会在足够长的时间后把生存概率压到零。图 9(c) 把它画成一条直线:要让人有 1% 的概率活到 200 岁,残余风险下限必须低于 0.0230/年,也就是平均每 43 年一次致命事件。
The proof is two lines: \(S(t)=\exp(-\int_0^t h)\le\exp(-\int_{t_0}^t h)\le e^{-h_0(t-t_0)}\), and \(t\to\infty\) gives the result; the converse is the same argument, since \(\int h<\infty\) implies \(S(\infty)>0\). The proposition says that “zero death risk” is not a very low risk but an integrable one; any positive floor, however small, drives survival to zero after enough time. Figure 9(c) draws it as a straight line: for a 1% chance of reaching 200, the residual hazard floor must be below 0.0230 per year — one fatal event per 43 years on average.
必须立刻区分数学与生物。命题是条件句:如果风险函数有正下限,那么无限生存概率为零。真实生物体是否具有这个性质,是一个经验问题。可能的情形包括:某些损伤的修复效率随年龄下降(下限上升)、某些风险可以被完全消除(下限为零)、以及”死亡”本身是多器官耦合的相变(风险函数不再是简单的 \(h(t)\))。模型能告诉我们的是:要把”永生”从概率零变成概率正,需要的不只是把几个风险因子压低,而是让所有剩余风险在无穷时间上的积分收敛。这比”再活五十年”难得多,也更值得被清楚地写出来。
Mathematics and biology must be separated at once. The proposition is conditional: if the hazard has a positive floor, then the probability of infinite survival is zero. Whether real organisms have this property is empirical. Possible cases include repair efficiency declining with age (a rising floor), some risks being eliminated completely (a zero floor), and death being a coupled multi-organ transition (the hazard is no longer a simple \(h(t)\)). What the model says is that turning “immortality” from probability zero into probability positive requires not lowering a few risk factors but making the integral of all remaining risk converge over infinite time. That is far harder than “fifty more years”, and it deserves to be stated plainly.
9. 人类距离真正的返老还童还有多远? / How far is human rejuvenation, really?
这一节把证据摊开。图 10(a) 是我对九类干预在六个证据层级上的评分(0 无、1 早期、2 中等、3 强):体外、小鼠寿命、哺乳动物组织功能、人体安全性、人体随机试验、健康寿命终点。判读结果:九类里只有 1 类在”健康寿命终点”上有哪怕微弱(1 分)的证据;6 类至少有一个随机人体试验;没有任何一类在该层级拿到 3 分。这个矩阵是判断,不是荟萃分析,但它的形状很难被误读:证据在”小鼠寿命”一层最厚,往上迅速变薄。
This section lays out the evidence. Figure 10(a) is my score for nine intervention families on six evidence levels (0 none, 1 early, 2 moderate, 3 strong): in vitro, mouse lifespan, mammalian tissue function, human safety, human randomised trial, healthspan endpoint. Reading: of the nine, only 1 has even weak (score 1) evidence at the healthspan level; 6 have at least one randomised human trial; none scores 3 at that level. The matrix is a judgement, not a meta-analysis, but its shape is hard to misread: evidence is thickest at the mouse-lifespan layer and thins rapidly above it.
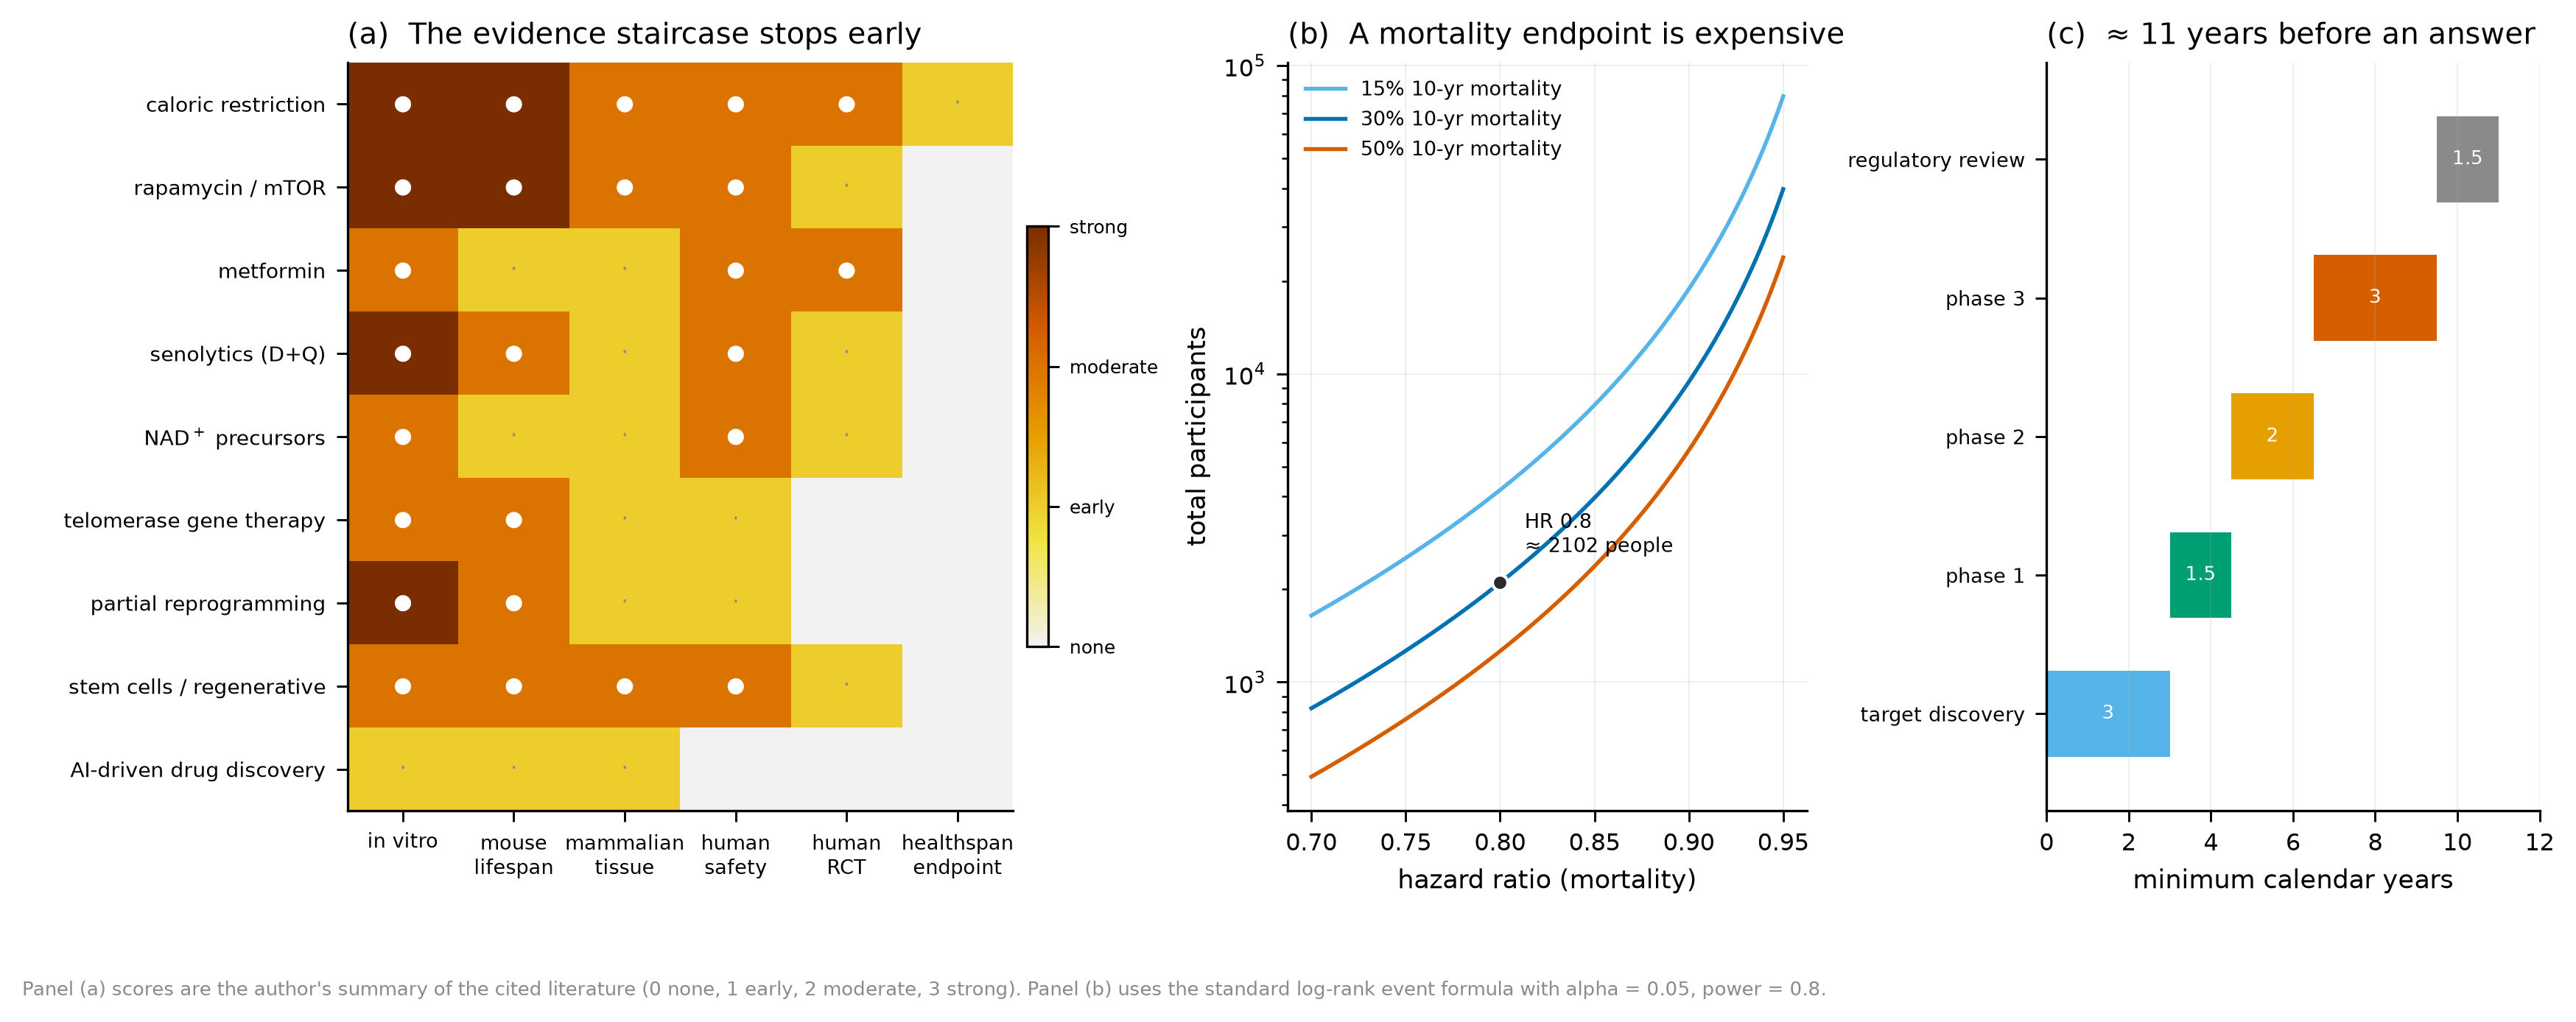
样本量是另一个不该被含糊的地方。对死亡率为终点的试验,所需事件数 \(D=4(z_{1-\alpha/2}+z_{1-\beta})^2/(\ln \mathrm{HR})^2\);在 \(\alpha=0.05\)、把握度 80% 下,HR 0.8 需要 631 个事件;如果 10 年死亡率是 30%,就需要约 2,102 人。这还只是统计学要求,不含入组速度、脱落、以及”药物是否真的改变了风险”这个更根本的问题。把从靶点发现到审评的最短时间相加,约 11 年——这是一切顺利的下限。
Sample size is another place where vagueness is unacceptable. For a mortality endpoint the required number of events is \(D=4(z_{1-\alpha/2}+z_{1-\beta})^2/(\ln \mathrm{HR})^2\); at \(\alpha=0.05\) and 80% power, HR 0.8 needs 631 events, and with 30% ten-year mortality that is about 2,102 people. That is only the statistical requirement; it ignores recruitment speed, dropout, and the more basic question of whether the drug changes risk at all. Summing the minimum time from target discovery to review gives about 11 years — a lower bound under everything going right.
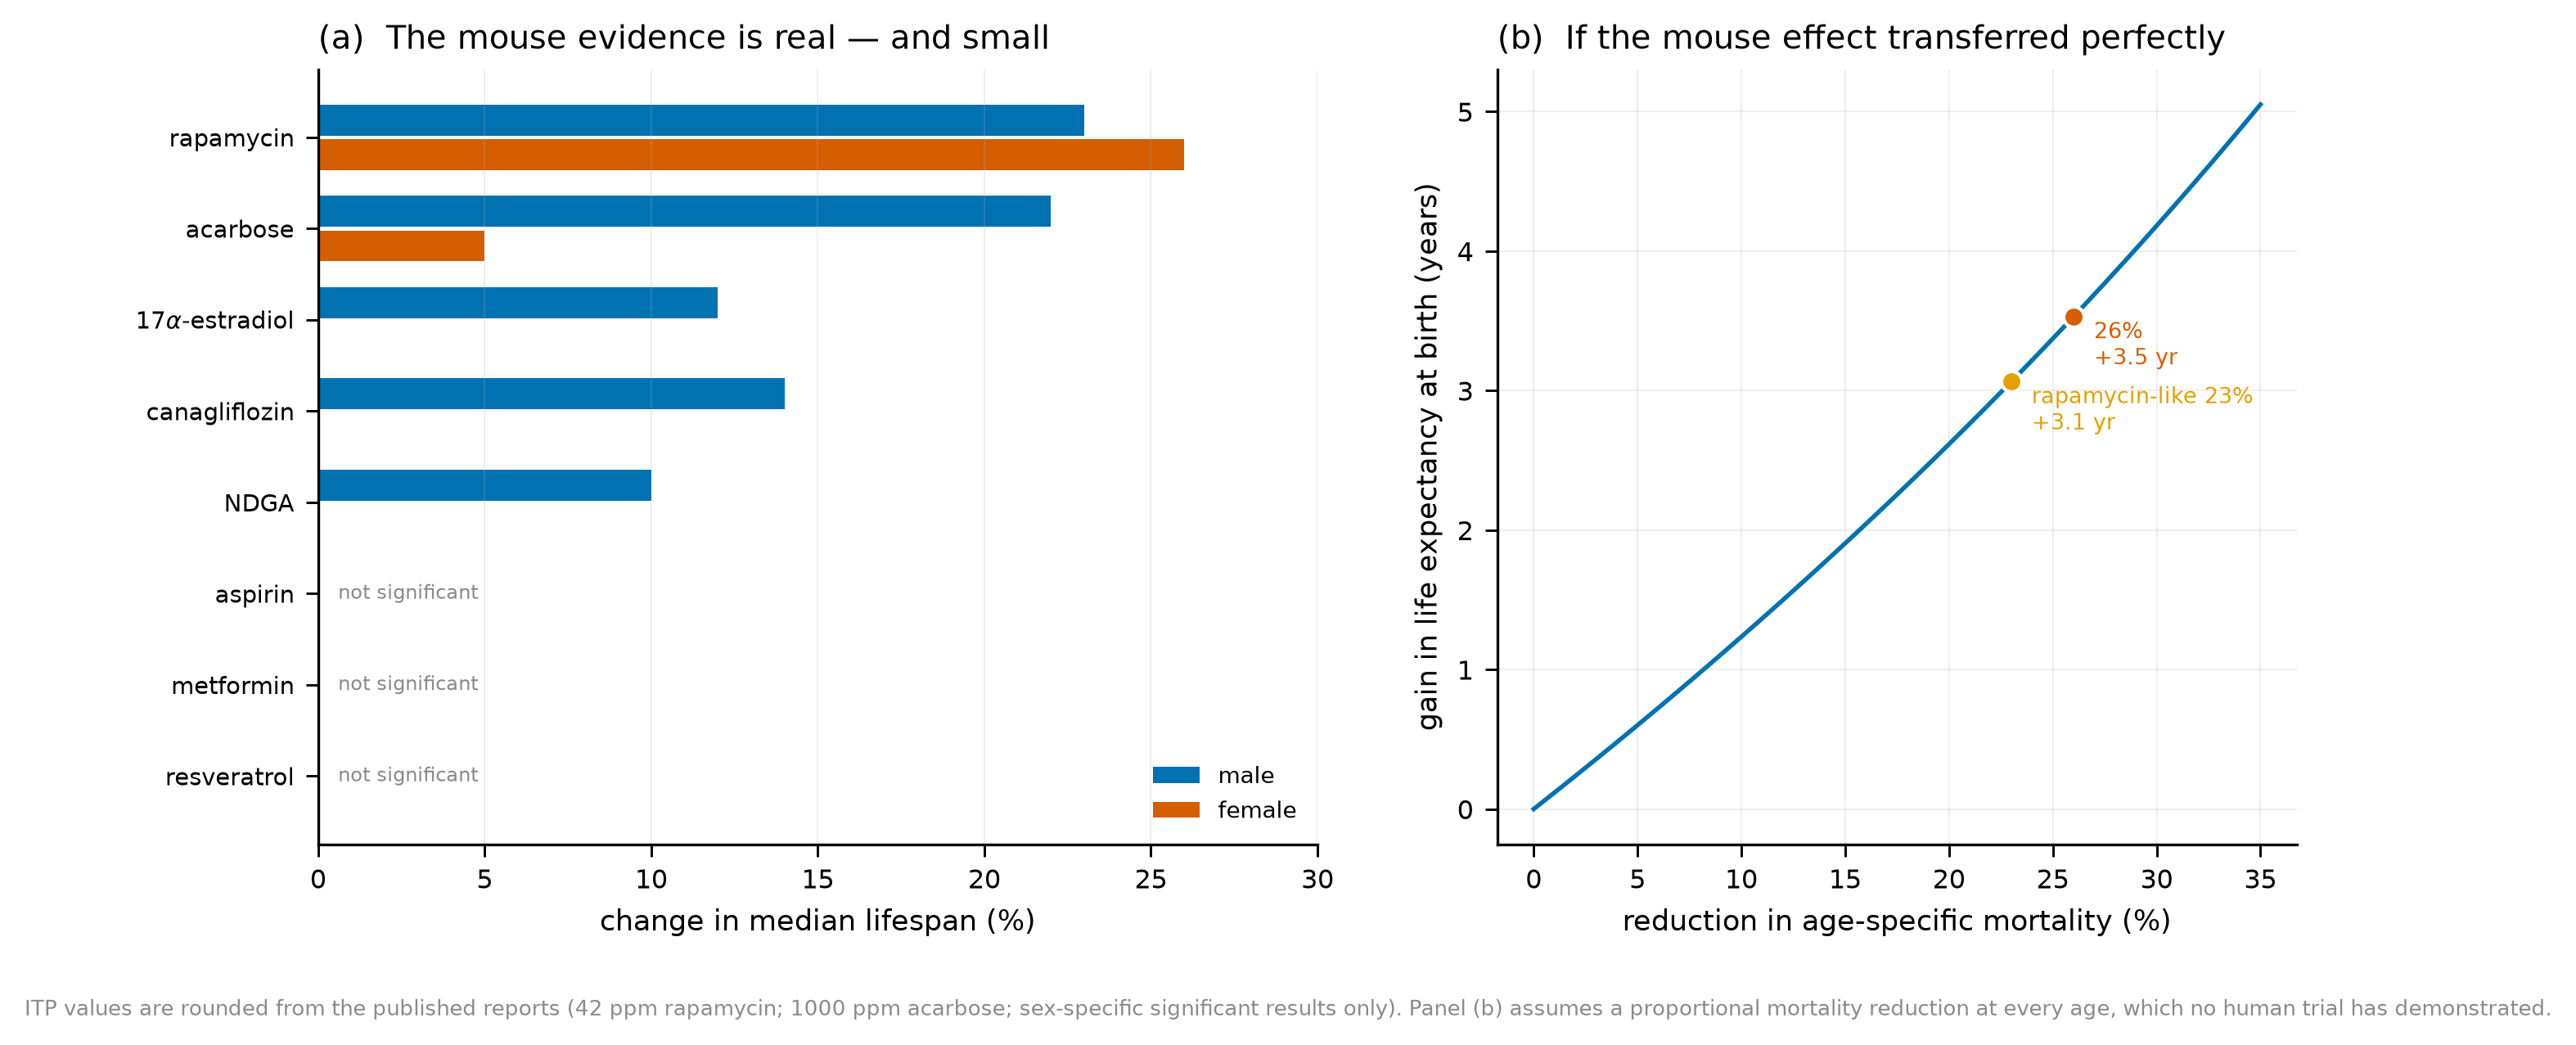
小鼠证据本身值得尊重。图 11 汇总了 NIA 干预测试计划(ITP)中达到显著的几种药物:雷帕霉素让雄性中位寿命延长约 23%、雌性约 26%,阿卡波糖在雄性约 22%、雌性约 5%,17α-雌二醇与卡格列净主要在雄性有效;阿司匹林、二甲双胍与白藜芦醇在 ITP 中未达显著。八种药物里,5 种在雄性显著,2 种在雌性显著。这不是”抗衰无效”的证据;它说明即使在控制最严的动物实验里,效应量也就是百分之十几到二十几,且强烈依赖性别与剂量。
The mouse evidence itself deserves respect. Figure 11 summarises agents that reached significance in the NIA Interventions Testing Program (ITP): rapamycin extends median lifespan by about 23% in males and 26% in females, acarbose by about 22% in males and 5% in females, while 17α-estradiol and canagliflozin work mainly in males; aspirin, metformin and resveratrol did not reach significance. Of eight agents, 5 are significant in males and 2 in females. This is not evidence that anti-ageing is futile; it shows that even in the best-controlled animal experiments the effect size is ten to twenty-odd percent, and depends strongly on sex and dose.
把几条路线分开看,会看到三种不同的”卡住”。热量限制卡在可行性与终点:两年 CALERIE 改善了风险因素,但长期依从性与健康寿命终点都难以获得;恒河猴的两项研究结论并不一致,一项显示延缓疾病与死亡,另一项在控制饮食量后差异变小。senolytics 卡在效应量与终点:小样本试验能降低衰老细胞标志物,但安慰剂对照试验在功能终点上没有差异,senolytic 的”靶点参与”与”临床获益”之间仍隔着一段。NAD⁺ 前体卡在剂量与因果:人体试验多显示 NAD⁺ 水平上升,却很少显示功能或代谢终点的稳健改善。端粒酶基因治疗卡在安全性:小鼠中延长寿命且不增加肿瘤,但人体尚无获批的全身性方案。把它们排成”成功/失败”会丢掉这些差别,而差别恰恰决定了下一步该测什么。
Looking at the routes separately reveals three different ways of being stuck. Caloric restriction is stuck on feasibility and endpoints: two years of CALERIE improved risk factors, but long-term adherence and healthspan endpoints are hard to obtain, and the two rhesus monkey studies disagreed — one showed delayed disease and death, the other found smaller differences after controlling for intake. Senolytics are stuck on effect size and endpoints: small trials lower senescent-cell markers, but placebo-controlled trials show no difference in functional endpoints, so target engagement and clinical benefit remain separated. NAD⁺ precursors are stuck on dose and causality: human trials usually raise NAD⁺ levels but rarely show robust functional or metabolic improvements. Telomerase gene therapy is stuck on safety: it extends lifespan in mice without increasing cancer, but no systemic human regimen is approved. Arranging them as “success/failure” would lose these distinctions, and the distinctions determine what to measure next.
那么,“2036 年前实现人体返老还童”该怎么判断?我拒绝给出任何成功概率,因为那需要一份我无法诚实地写出的先验。可以给的是一个分层判断,每一层都写明假设:局部组织功能恢复(例如角膜、视网膜、皮肤)在 2036 年前有现实可能,因为已有局部递送与安全性数据;特定疾病中的”年轻化治疗”可能作为附带的疗效终点出现;部分衰老指标改善几乎肯定会继续出现,但它的临床意义取决于指标是否被验证;系统性全身年轻化需要多器官、多系统同时改变,且要通过至少一次大型随机试验,按本节的算术,这不太可能在 2036 年前完成;让高龄成年人恢复接近青年人的多器官功能,需要的不只是干预,而是重建;持续停止人体衰老,则触及第 8 节的数学边界,目前没有任何证据表明可行。
So how should “human rejuvenation by 2036” be judged? I refuse to give a probability of success, because that would require a prior I cannot honestly write down. What I can give is a layered judgement, each layer with its assumptions: local tissue restoration (cornea, retina, skin, for example) is realistically possible before 2036, given existing local delivery and safety data; “rejuvenating treatment” in a specific disease may appear as a secondary endpoint; improvement in some ageing biomarkers will almost certainly continue, but its clinical meaning depends on whether the markers are validated; systemic whole-body rejuvenation requires simultaneous change across organs and at least one large randomised trial, which by the arithmetic of Section 9 is unlikely to complete before 2036; restoring multi-organ function in the very old to near-youthful levels requires not treatment but rebuilding; and halting human ageing altogether runs into the mathematical boundary of Section 8, with no evidence that it is feasible.
在讨论技术之前,先看人口学。20 世纪寿命的大幅增长主要来自婴幼儿死亡率的下降与心血管疾病的控制;1990 年以后,高收入国家的寿命增益在减速。Olshansky 等(2024)分析了寿命最长的八个国家加香港与美国的数据,认为在本世纪内实现”激进寿命延长”的可能性很低;2025 年一项多方法队列预测显示,此前每代人约 0.46 年的寿命改善速度下降了 37%–52%,没有一代人(1939 年后出生)预计能平均活到 100 岁。目前有确证的人类最长寿命仍是 122 岁(Jeanne Calment)。这些数字不证明”人类不可能更长寿”,但它们说明:即使把现有医学做得更好,人口学上的收益也在变慢;任何声称”十年内系统性逆转”的叙事,都必须解释它如何突破这条曲线。
Before the technology, look at demography. The great lifespan gains of the twentieth century came mainly from falling infant mortality and cardiovascular control; since 1990, gains in high-income countries have decelerated. Olshansky et al. (2024) analysed the eight longest-lived countries plus Hong Kong and the United States and concluded that “radical life extension” within this century is implausible; a 2025 multi-method cohort forecast found that the previous improvement of about 0.46 years per cohort had fallen by 37–52%, and that no cohort born after 1939 is expected to average 100 years. The verified human maximum remains 122 (Jeanne Calment). These numbers do not prove that longer life is impossible, but they say that even doing existing medicine better yields diminishing demographic returns; any claim of “systemic reversal within a decade” must explain how it breaks that curve.
10. 从古代方士到现代长寿叙事 / From ancient fangshi to modern longevity narratives
最后回到那张”80 岁回到 20 岁”的图。我列了十个系统(图 12):体细胞基因组、端粒、表观基因组、蛋白稳态、线粒体、衰老细胞、干细胞池、细胞外基质、血管与肾脏、免疫系统。其中六个有可引用的”相对青年丢失百分比”(端粒约 30%、线粒体呼吸能力约 30%、naive CD8 T 细胞约 80%、皮肤弹性约 30%、肾单位约 40%、胸腺输出约 90%);另外四个(体细胞突变数、表观遗传年龄、蛋白聚集负荷、衰老细胞比例)有明确的量,但无法概括成单一的”丢失百分比”——衰老细胞是从约 1% 升到约 10%,而不是”丢失”——所以我用斜线阴影表示,而不是编一个数字。
Return to the “80 back to 20” picture. I listed ten systems (Figure 12): somatic genome, telomeres, epigenome, proteostasis, mitochondria, senescent cells, stem-cell pool, extracellular matrix, vasculature and kidney, immune system. Six have a citable “percentage lost relative to youth” (telomeres about 30%, mitochondrial respiratory capacity about 30%, naive CD8 T cells about 80%, skin elasticity about 30%, nephrons about 40%, thymic output about 90%); the other four (somatic mutation count, epigenetic age, aggregate load and the senescent-cell fraction) have definite quantities that do not reduce to a single “percentage lost” — senescent cells rise from about 1% to about 10%, which is not a loss — so they are hatched rather than given an invented number.
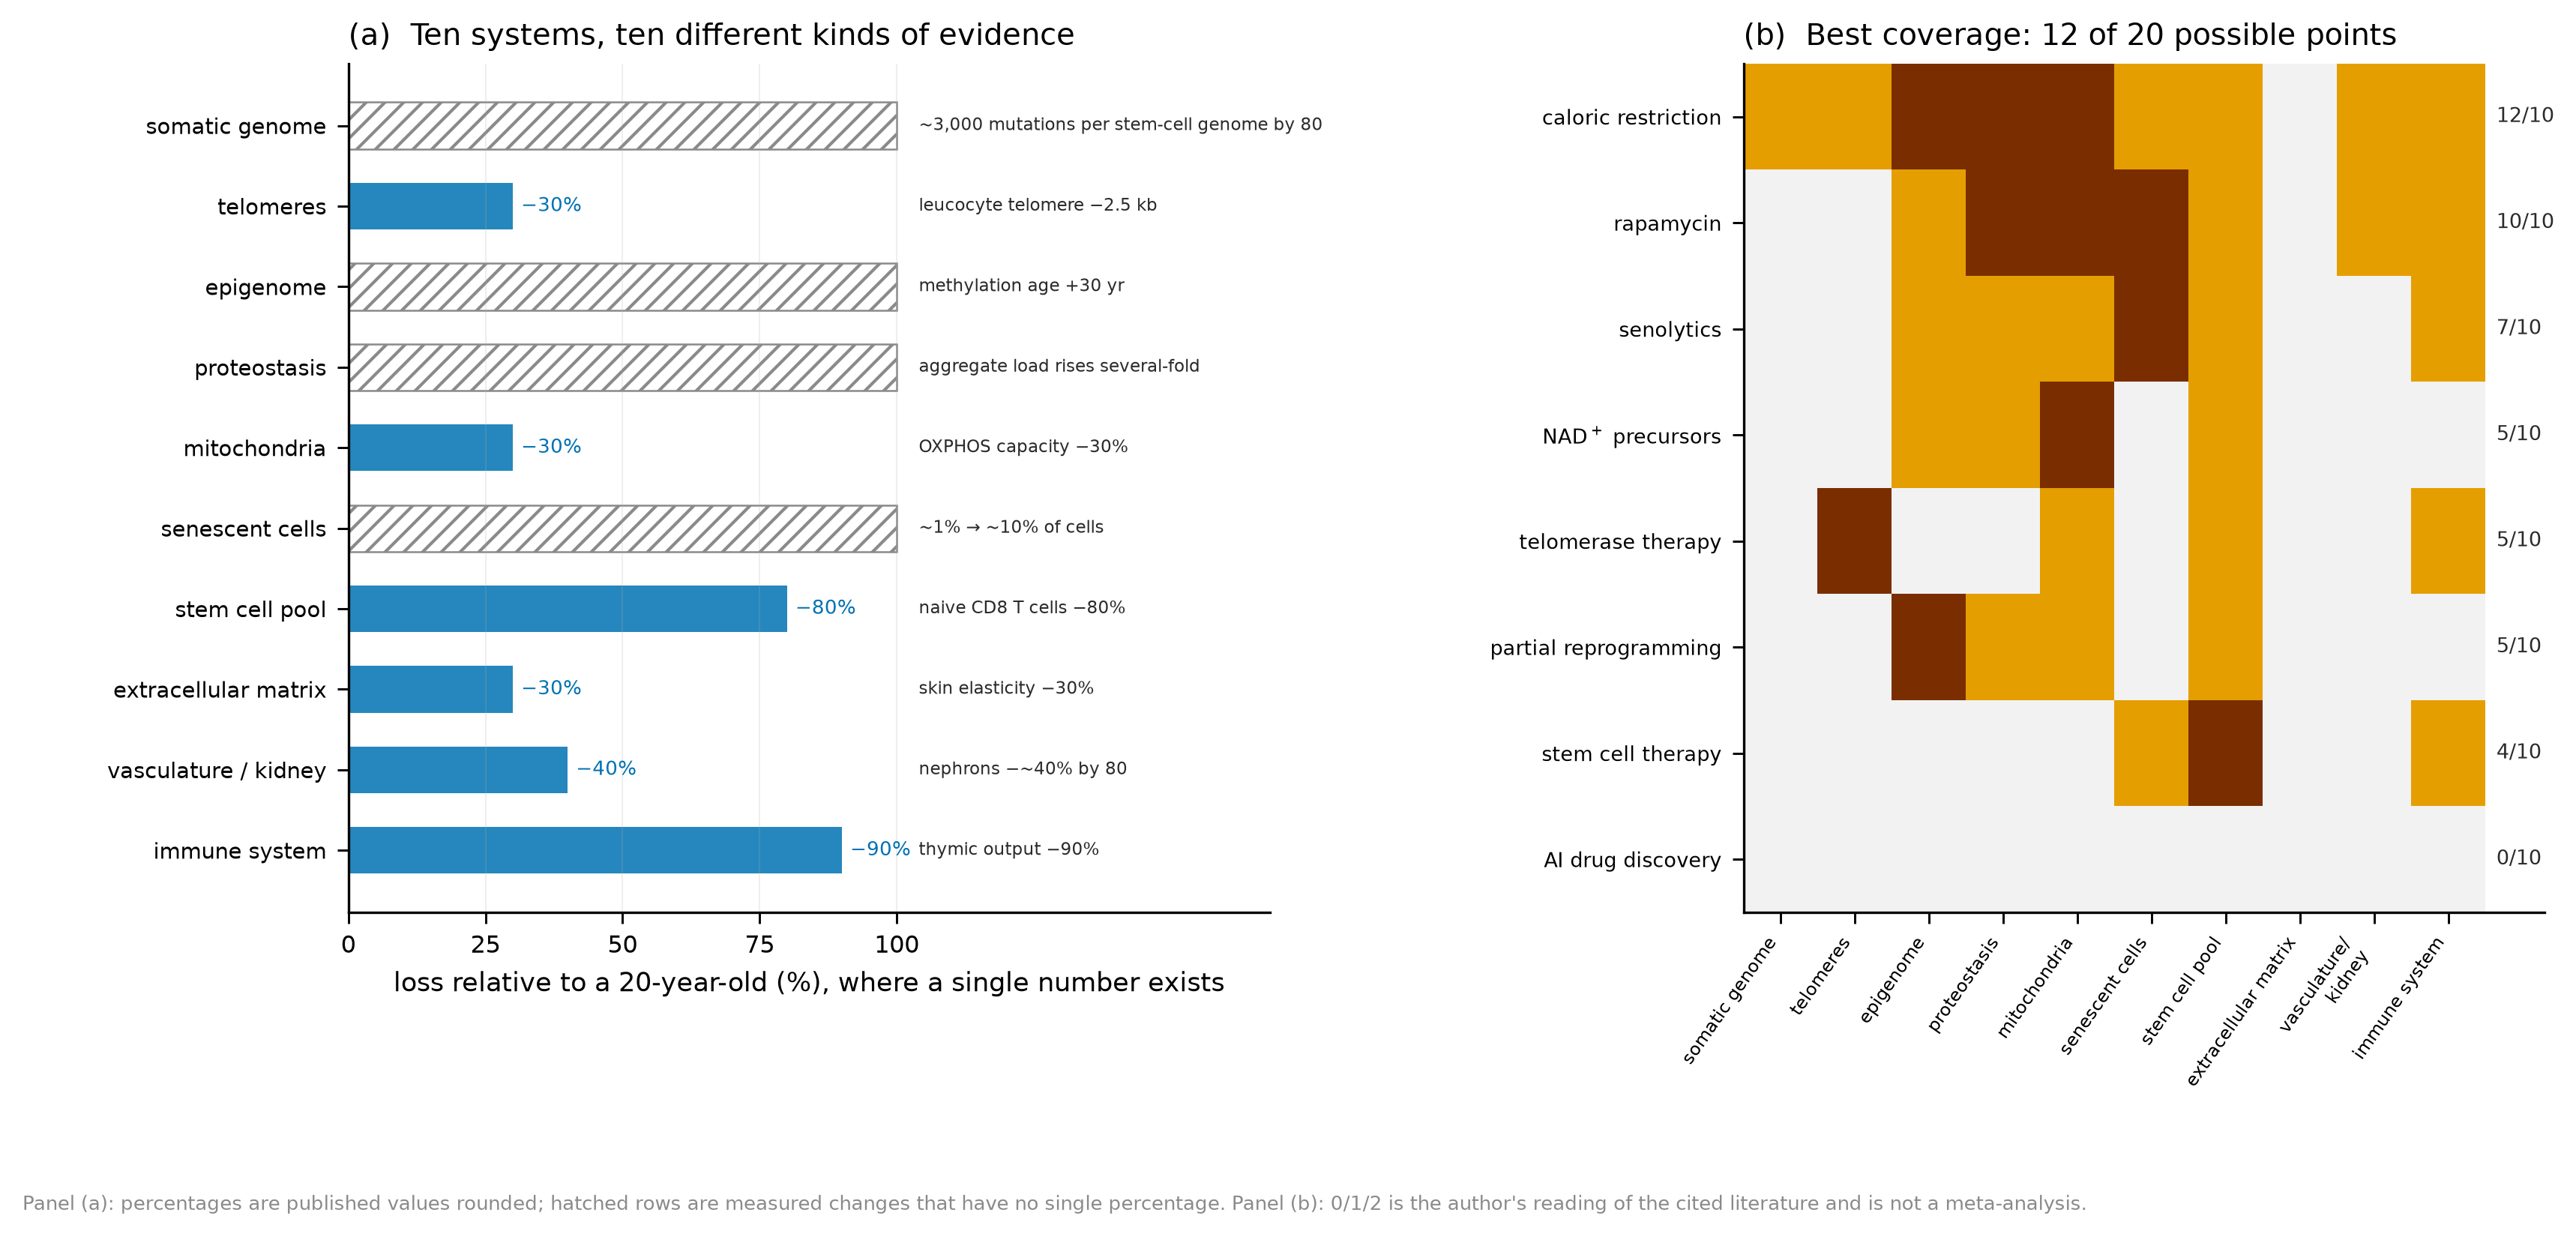
这张图的两个面板回答了本文的两个问题。第一,我们要修复的是什么:不是”年龄”,而是十个相互耦合、证据类型各不相同的系统;把它们加成一个分数会制造精确的假象。第二,现有干预能覆盖多少:最强的一项也只覆盖 12/20 个可能得分点,平均 6/20;没有任何一项在超过三个系统上有直接证据。这不是说干预无用——热量限制、雷帕霉素、senolytics 在各自的目标上都有真实数据——而是说“全身年轻化”要求的覆盖度,比任何单一干预能提供的都高一个量级。
The two panels answer the article’s two questions. First, what needs repairing: not “age” but ten coupled systems with different kinds of evidence; summing them into one score would manufacture precision. Second, how much current interventions cover: the best reaches 12/20 possible points, the mean is 6/20, and none has direct evidence for more than three systems. This does not make interventions useless — caloric restriction, rapamycin and senolytics have real data on their targets — but it says that the coverage required for whole-body rejuvenation is an order of magnitude beyond what any single intervention provides.
那么,我们今天究竟已经逆转了什么?把话说得尽量具体:我们可以在局部逆转一些与年龄相关的表型(例如白内障手术、部分皮肤与角膜病变、造血干细胞移植重建免疫系统);可以在动物中延长中位寿命百分之十几到三十几;可以在分子层面改变一些衰老标志(甲基化年龄、SASP 因子、线粒体功能指标);可以在特定疾病中改善结局(senolytics 在部分小样本试验中的生物标志物信号)。我们没有做到的,是在一个健康老年人身上,同时、持久、安全地把多个器官系统的功能恢复到青年水平,并且证明这带来了临床上有意义的健康寿命延长。
So what have we actually reversed? Be as concrete as possible. We can reverse some age-related phenotypes locally (cataract surgery, some skin and corneal lesions, immune reconstitution after haematopoietic stem-cell transplantation); we can extend median lifespan in animals by ten to thirty-odd percent; we can change some hallmarks at the molecular level (methylation age, SASP factors, mitochondrial indicators); we can improve outcomes in specific diseases (biomarker signals for senolytics in some small trials). What we have not done is restore multiple organ systems in a healthy older adult simultaneously, durably and safely to youthful function, and show that this produces a clinically meaningful extension of healthspan.
这就是古代方士与现代长寿叙事之间真正的差别,也是本文想守住的那条线。方士的承诺无法被检验,所以它只能靠权威与信仰维持;现代研究的承诺可以被检验,所以它必须接受失败、重复与终点的约束。把早期机制研究包装成”即将实现的返老还童”,在结构上确实是”穿着实验室白大褂的现代长生术”——但这句话批评的是一种叙事方式,不是研究者本人,也不是衰老研究这条路线。真正值得投入的,恰恰是把”哪个指标改变了、改变了多少、在谁身上、持续多久、代价是什么”这些问题一个个测清楚的研究。
This is the real difference between the ancient fangshi and modern longevity narratives, and the line this article tries to hold. The fangshi’s promise could not be tested, so it survived on authority and faith; modern research can be tested, so it must accept failure, replication and endpoints. Packaging an early mechanistic result as “rejuvenation around the corner” is structurally a modern immortality art in a lab coat — but the criticism targets a narrative style, not the researchers, and not the field. What deserves investment is precisely the work that measures, one question at a time, which marker changed, by how much, in whom, for how long, and at what cost.
那么,一场能真正回答”系统性返老还童是否成立”的试验会是什么样子?它至少要同时满足五条:多器官终点(心、肾、肌肉、免疫、认知各有一项硬指标,而不是一个甲基化数字);足够长的随访(十年以上,或至少覆盖主要慢性病的发病窗口);足够大的样本(按第 9 节的算术,死亡或复合终点需要数千人);可接受的安全性(包括癌症与感染的长期监测);以及独立重复。这五条没有一条是”技术难题”,它们全是组织与时间的难题。也正因如此,真正的瓶颈往往不是”想不出机制”,而是”没有把机制验证到临床的耐心与基础设施”。
So what would a trial capable of answering “is systemic rejuvenation real?” look like? It would need five things at once: multi-organ endpoints (a hard measure for heart, kidney, muscle, immune function and cognition, not one methylation number); long enough follow-up (a decade or more, or at least the window in which major chronic diseases emerge); a large enough sample (by the arithmetic of Section 9, thousands for a mortality or composite endpoint); acceptable safety (including long-term cancer and infection monitoring); and independent replication. None of these is a “technical problem”; all are problems of organisation and time. That is also why the real bottleneck is often not “nobody can think of a mechanism” but “nobody has the patience and infrastructure to validate mechanisms in the clinic”.
最后,让我把四类知识再标一次,因为整篇文章的可靠性依赖于它们不互相冒充。已有实验证据:十二项衰老标志的清单、热量限制与雷帕霉素在小鼠中的寿命效应、OSKM 重编程与畸胎瘤风险、senolytics 在人体中的小样本信号、ITP 的性别差异。数学命题:低维时钟无法区分高维状态(非单射);风险函数有正下限则无限生存概率为零。模型模拟结果:进化取舍的方向、多维干预的反弹与弱协同、重编程的安全窗形状、再生强度与癌症风险的非线性权衡、多器官模型的寿命增益。作者假说:安全性的三个可测量门槛、覆盖度比单点效力更重要、以及”年轻”应当被定义为一个区域而不是一个数字。四者之间的边界,比任何一个具体结论都更值得记住。
Finally, label the four kinds of knowledge once more, because the article’s reliability depends on their not impersonating one another. Experimental evidence: the list of twelve hallmarks, the lifespan effects of caloric restriction and rapamycin in mice, OSKM reprogramming and teratoma risk, small human senolytic signals, and sex differences in the ITP. Mathematical propositions: a low-dimensional clock cannot distinguish high-dimensional states (non-injectivity); a hazard with a positive floor implies zero probability of infinite survival. Model output: the direction of evolutionary trade-offs, relapse and weak synergy in multi-dimensional interventions, the shape of the reprogramming safety window, the nonlinear trade-off between regeneration and cancer, and lifespan gains in the multi-organ model. Author’s hypotheses: the three measurable safety thresholds, the primacy of coverage over single-target potency, and the definition of “young” as a region rather than a number. The boundaries between the four are more worth remembering than any single conclusion.
两千多年前,人类把永生的希望寄托在一颗丹丸上。今天,我们终于能说出衰老的几十个分子过程,能在小鼠身上延长寿命,能在培养皿里把细胞变年轻,也能用数学说明”让死亡风险归零”需要什么条件。但理解一个部件,和重新掌握整个生命过程,仍然是两件不同的事。真正的进步,不是把”返老还童”说得更响,而是把”我们究竟逆转了什么”说得更准。
More than two thousand years ago, people pinned the hope of immortality on a single pill. Today we can name dozens of molecular processes of ageing, extend lifespan in mice, rejuvenate cells in a dish, and state mathematically what “zero death risk” would require. But understanding a part and re-mastering a whole life remain different things. Real progress is not saying “rejuvenation” more loudly; it is saying more precisely what, exactly, we have reversed.
11. 补充分析:人口学、时钟分歧与干预时机 / Supplementary analyses: demography, clock disagreement and timing
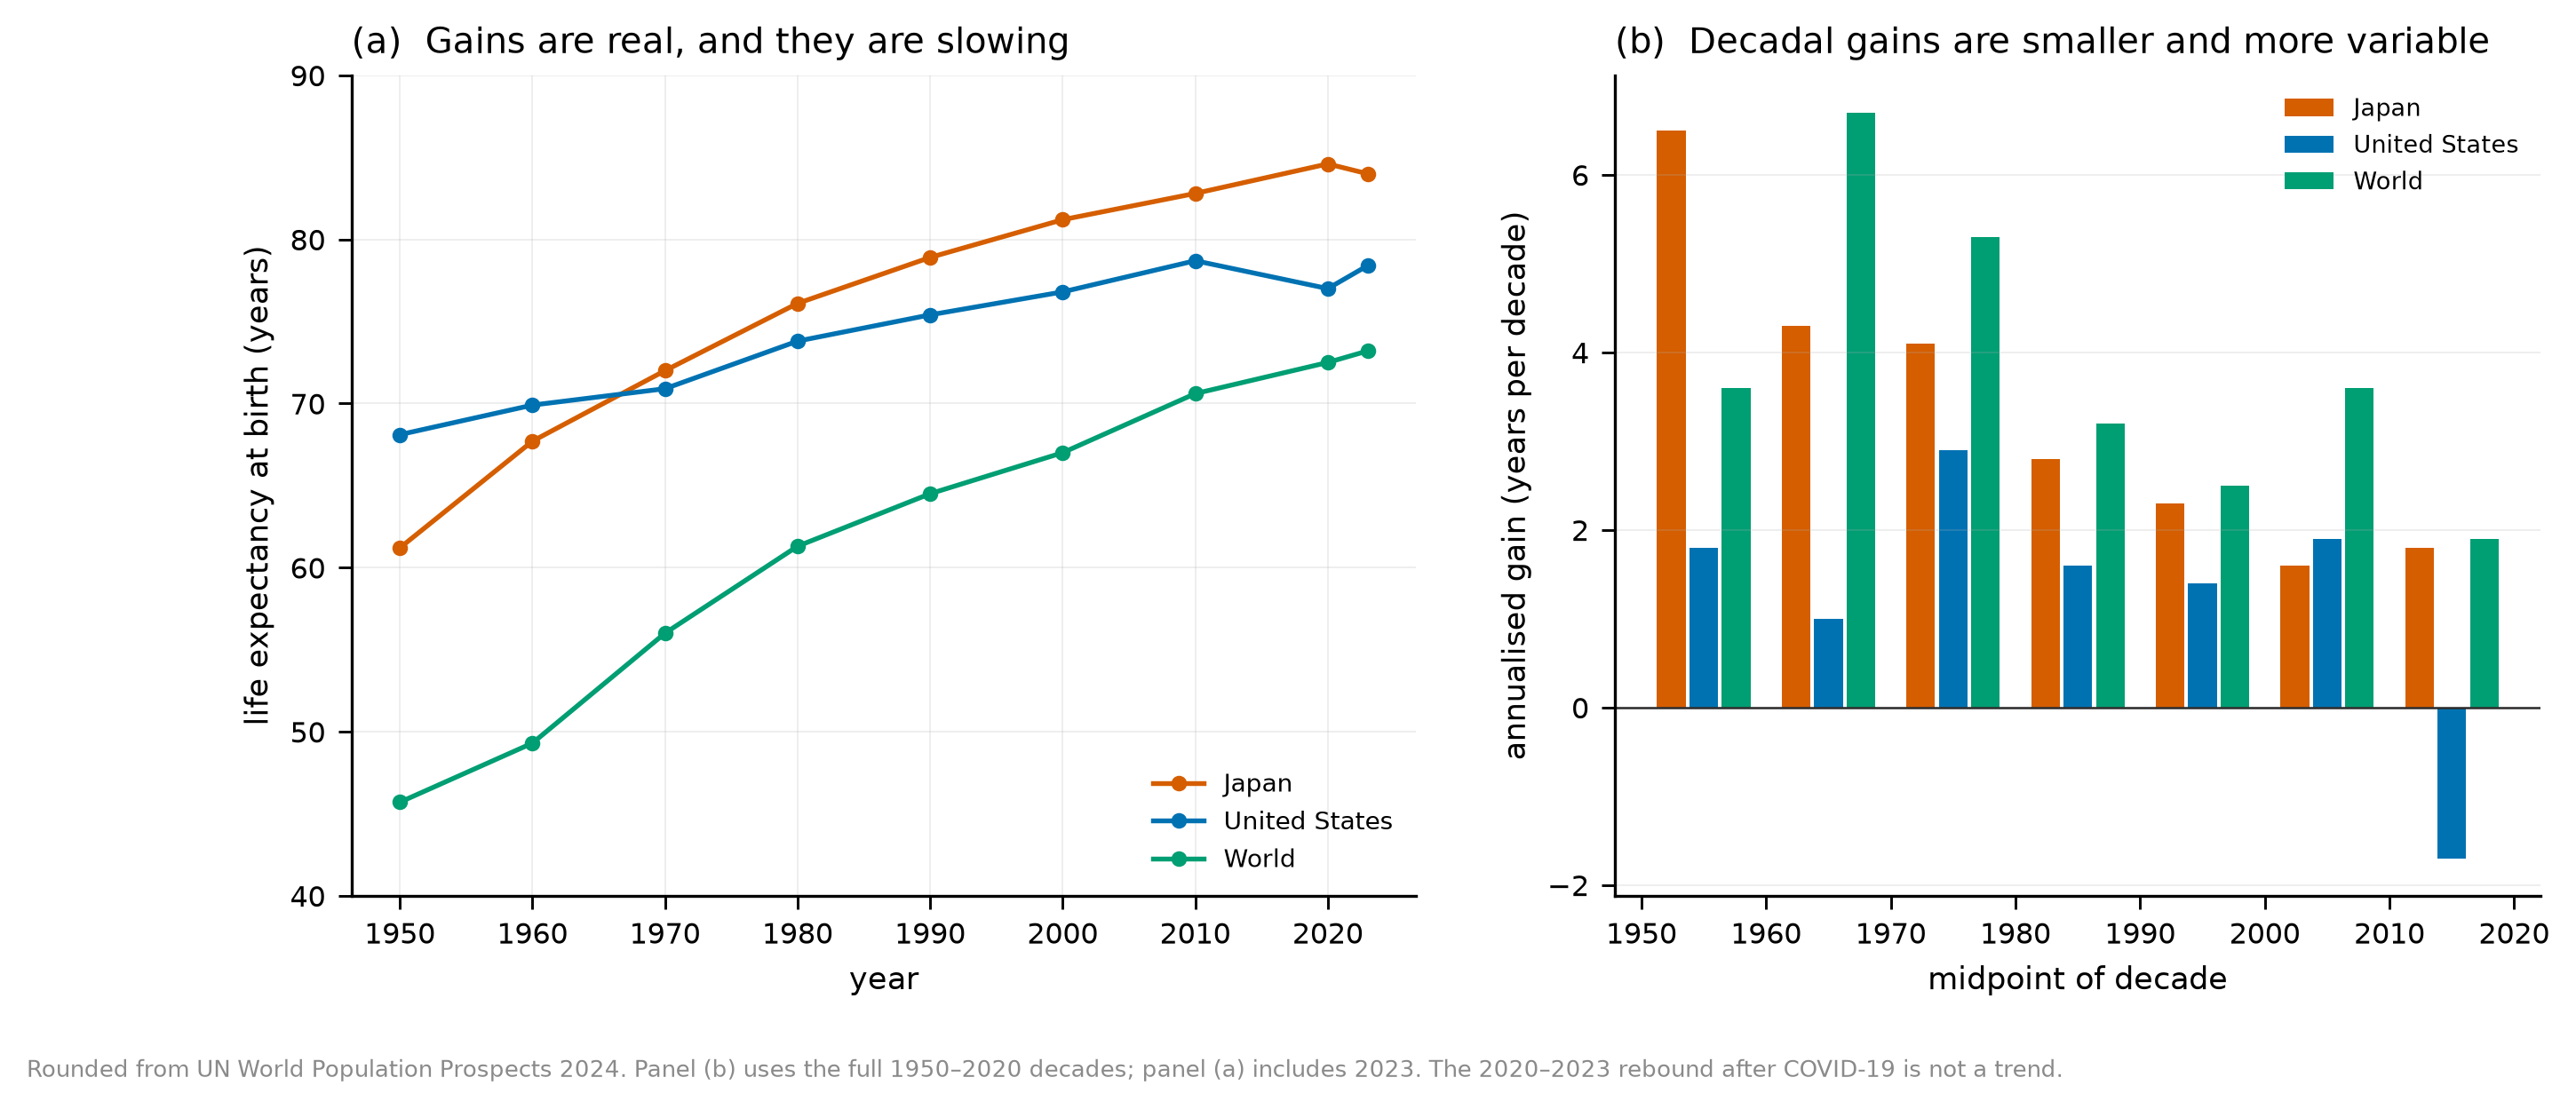
三张补充图不改变正文结论,但补上三个容易被忽略的量化背景。第一张是人口学:日本出生时预期寿命从 1950 年的 61.2 岁升到 2023 年的 84.0 岁,全球从 45.7 岁升到 73.2 岁;但每十年的增益在下降,日本从 1950–1960 年的 6.5 年/十年降到 2010–2020 年的约 1.8 年/十年,2020–2023 年甚至转为负值。把这条曲线与”十年内系统性逆转”的叙事放在一起,就会发现后者需要解释的不仅是生物学,还有人口学。
The three supplementary figures do not change the conclusions, but they add quantitative background that is easy to skip. The first is demography: Japanese life expectancy at birth rose from 61.2 years in 1950 to 84.0 in 2023, and the world from 45.7 to 73.2; but the gain per decade has fallen, from 6.5 years per decade in 1950–1960 to about 1.8 in 2010–2020, and negative in 2020–2023. Put this curve next to “systemic reversal within a decade” and the claim has to explain not only biology but demography.
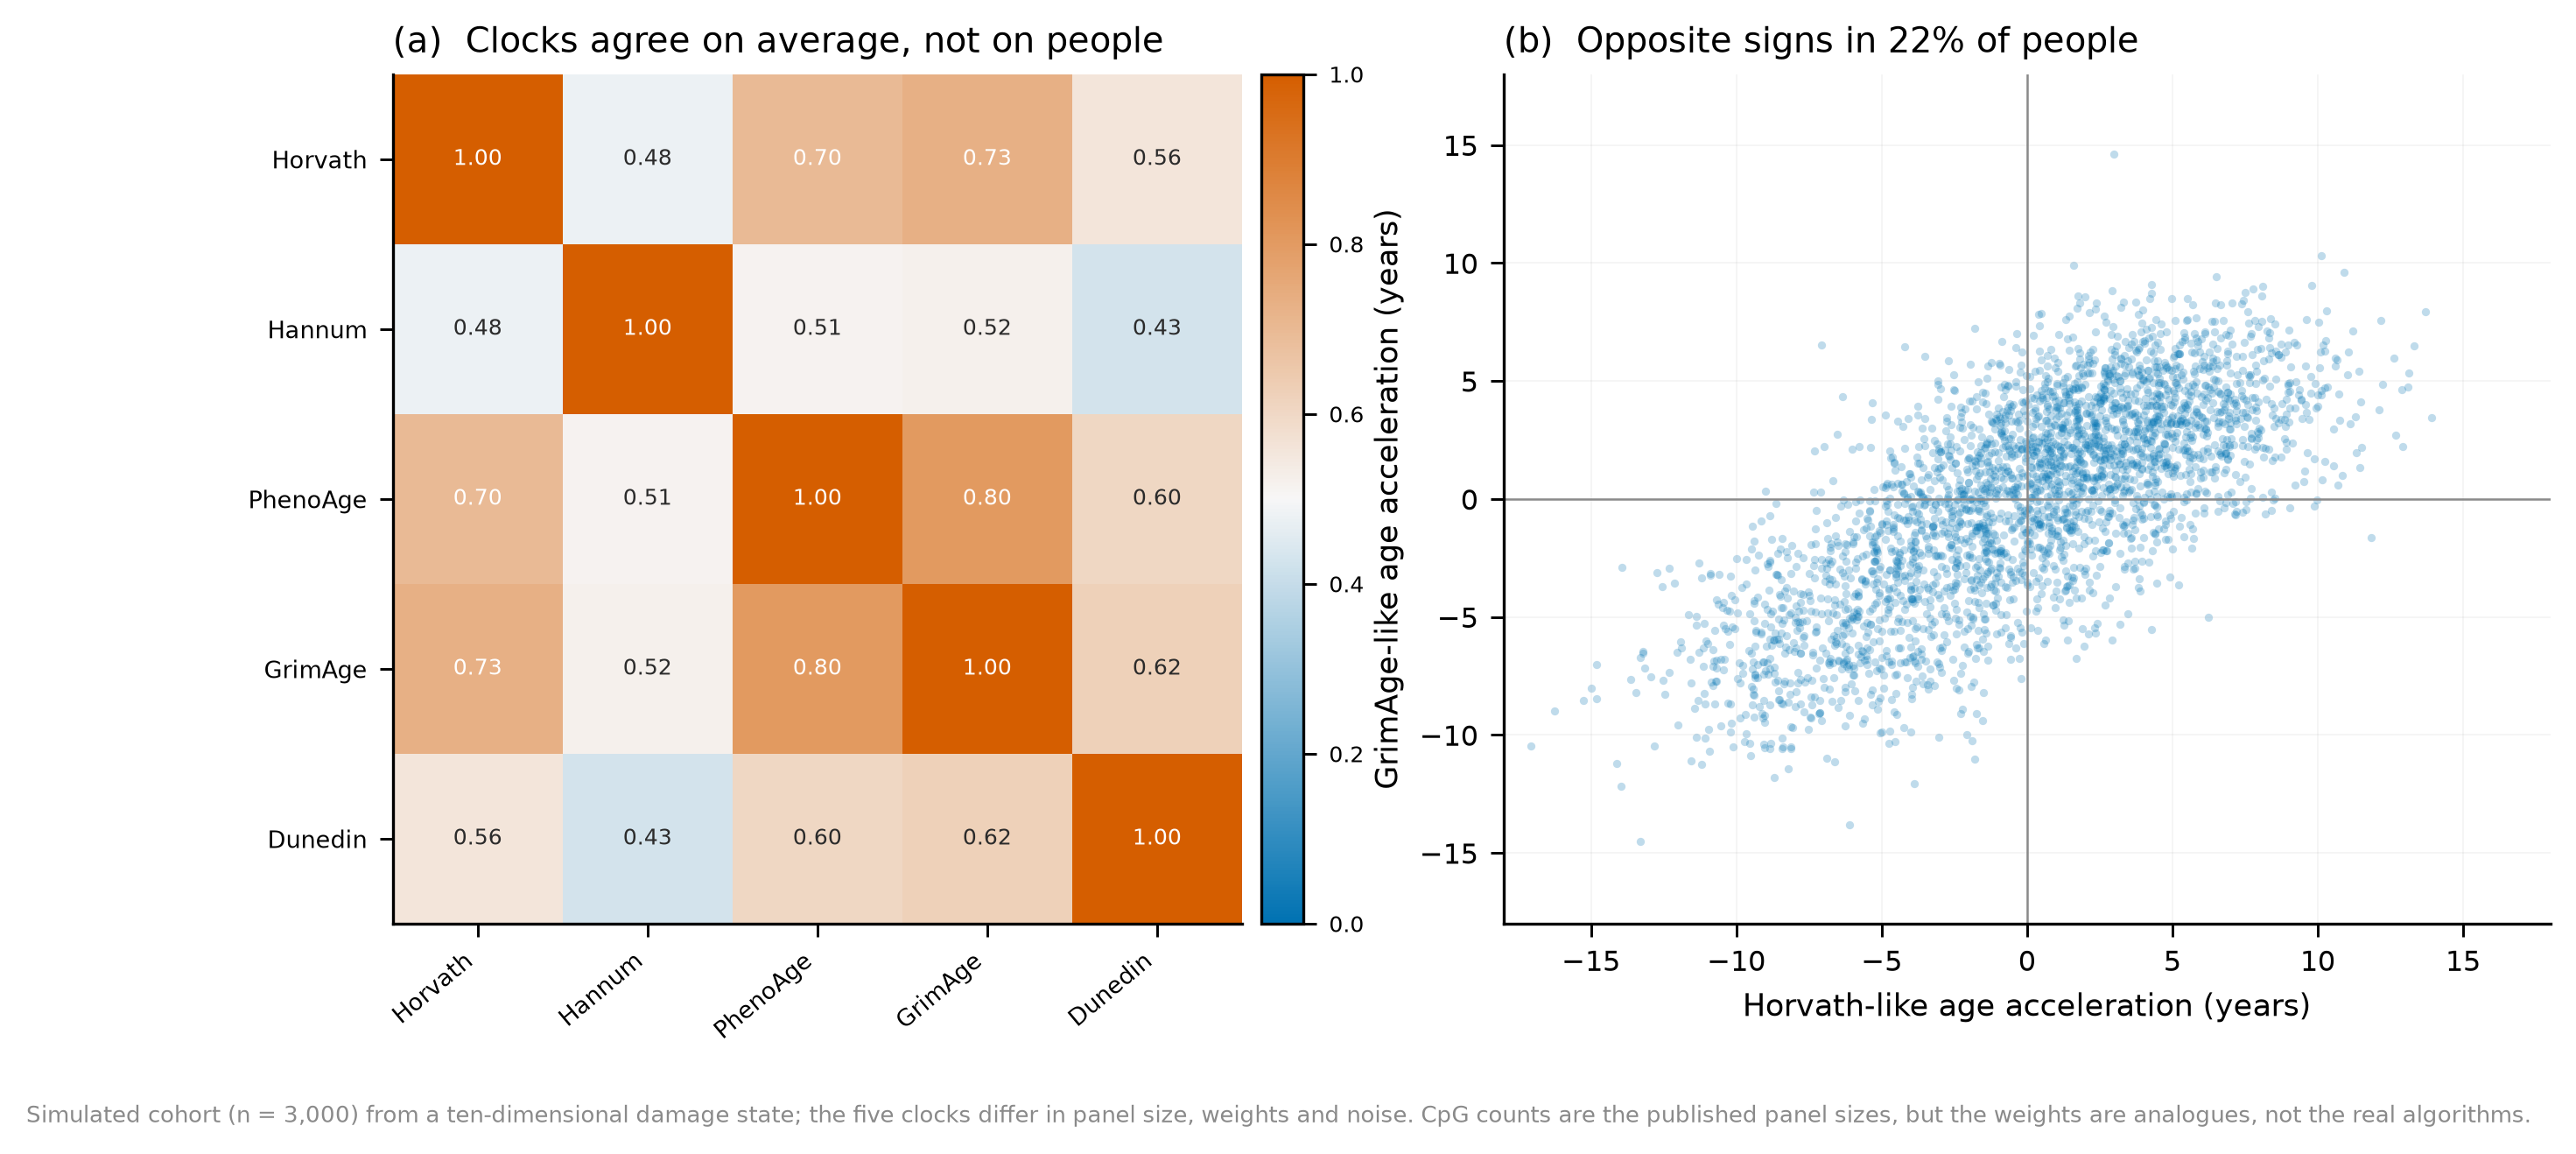
第二张是时钟分歧。我用同一个十维状态训练了五个”类时钟”(面板大小取真实时钟的 CpG 数:Hannum 71、DunedinPACE 173、Horvath 353、PhenoAge 513、GrimAge 1030),它们的残差两两相关平均 0.60(范围 0.43–0.80),但在 21.6% 的个体上,两个时钟给出的”更年轻/更老”方向相反。模型结果:五个都”预测得不错”的时钟,在个体层面可以互相矛盾;这正好说明为什么单一读数不能作为返老还童的判决。
The second is clock disagreement. I trained five “clock-like” models on the same ten-dimensional state (panel sizes taken from the real clocks: Hannum 71, DunedinPACE 173, Horvath 353, PhenoAge 513, GrimAge 1030). Their residuals correlate at 0.60 on average (range 0.43–0.80), but in 21.6% of individuals the two clocks point in opposite directions. Model output: five clocks that all “predict well” can contradict each other at the level of a person — which is exactly why a single reading cannot be the verdict on rejuvenation.
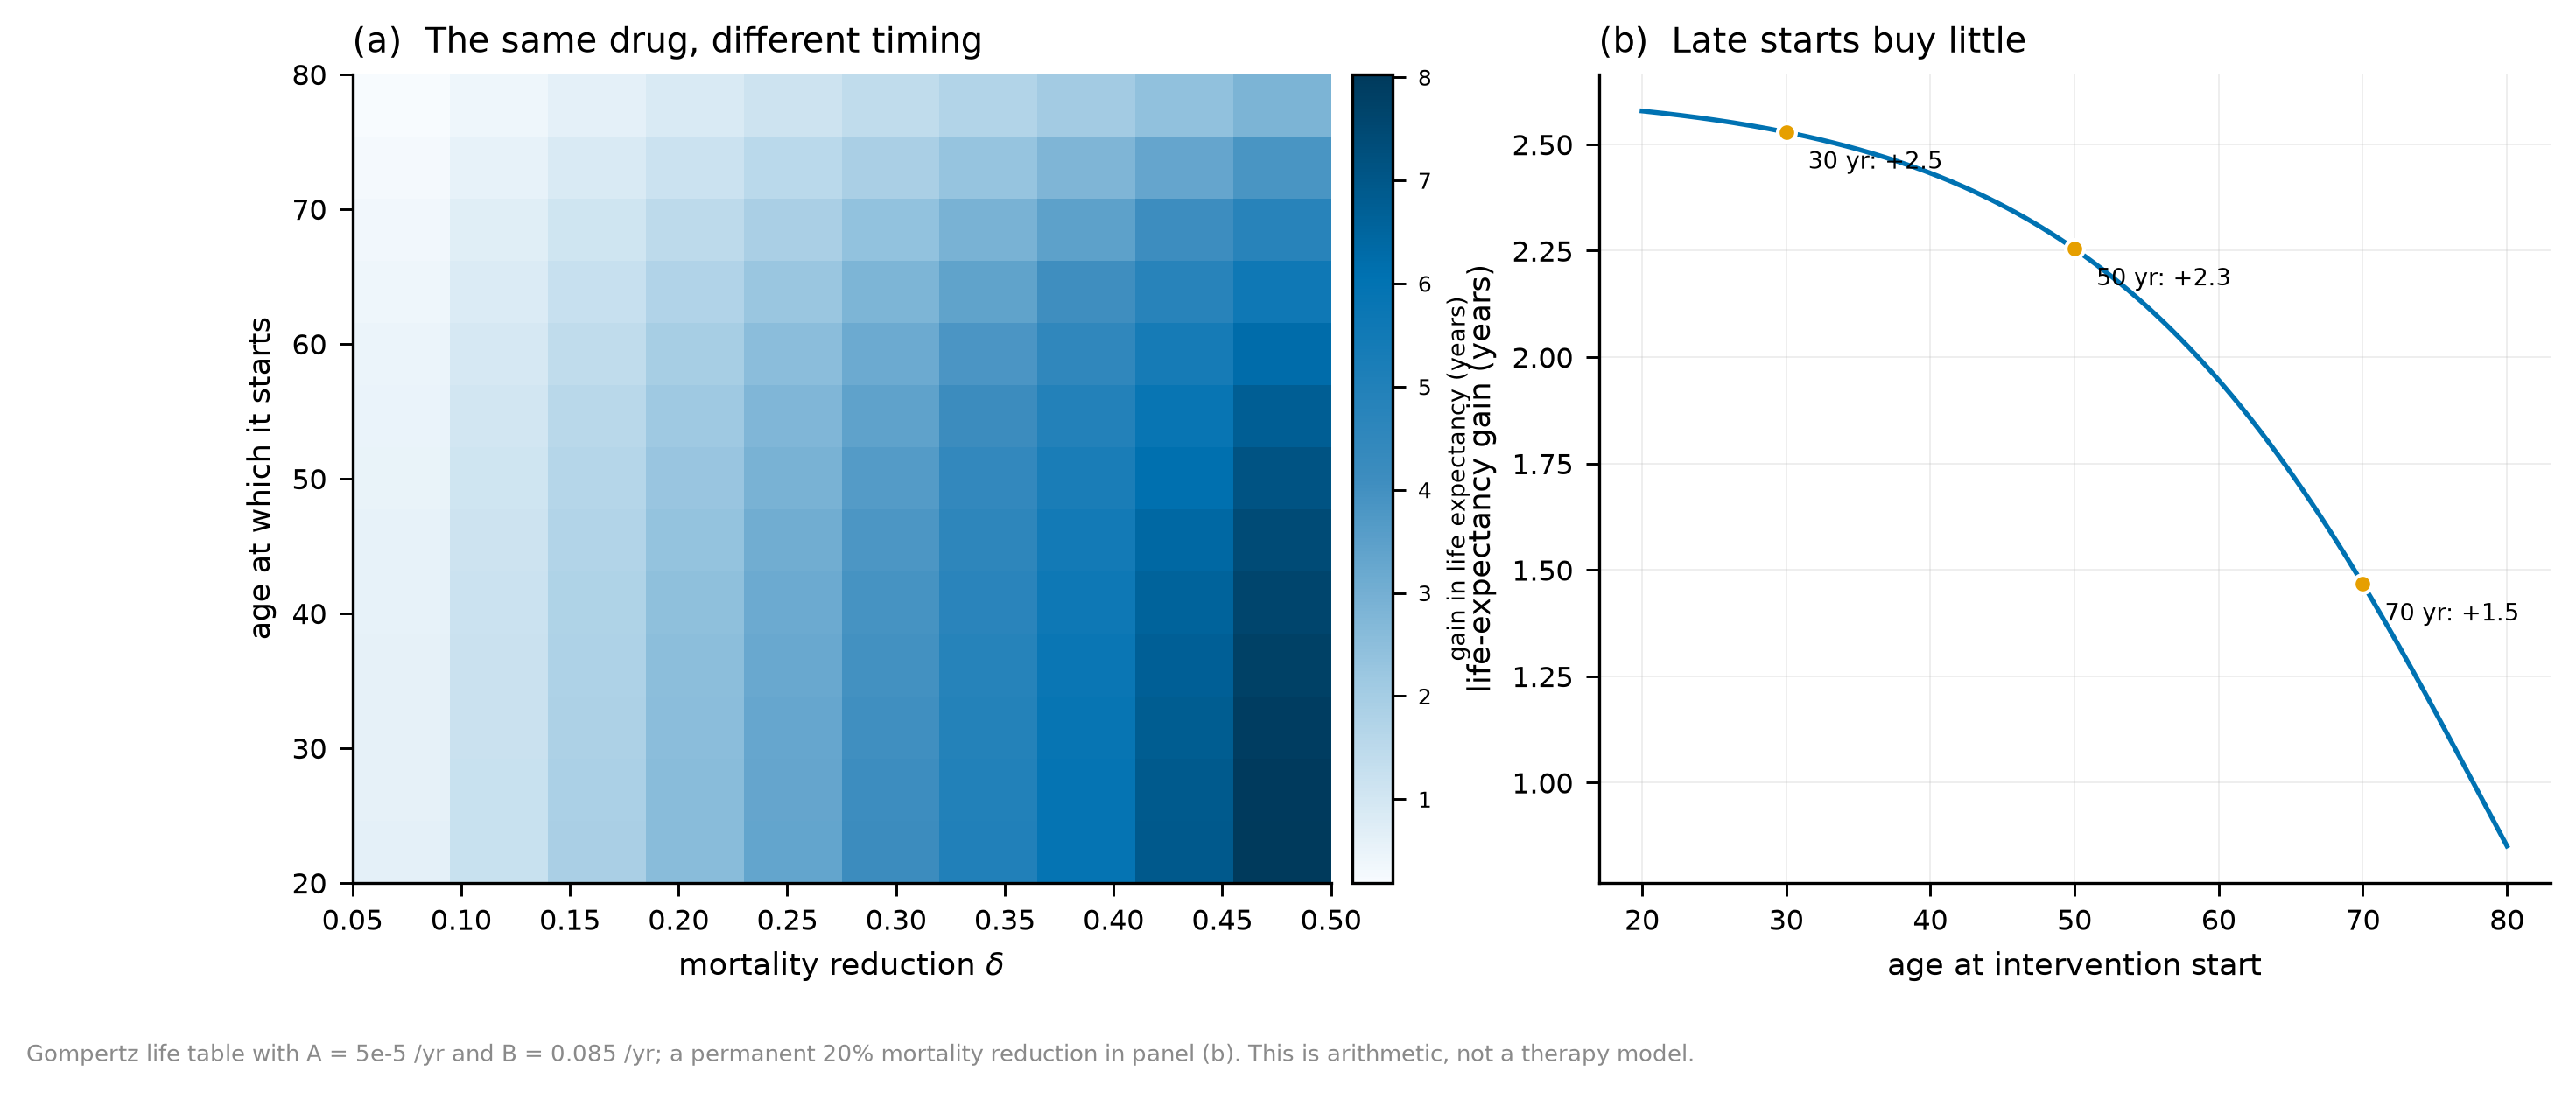
第三张是干预时机。在同一个 Gompertz 生命表上,把死亡率永久降低 20%,如果在 30 岁开始,生命期望增加 2.5 年;50 岁开始增加 2.3 年;70 岁开始只剩 1.5 年。即使把降幅提高到 50%,80 岁开始也只增加 2.9 年,而 20 岁开始可以增加 8.0 年。数学命题的直接推论:在指数上升的风险曲线上,同样的相对降幅,越晚使用,绝对收益越小;这也是为什么”老年才开始抗衰”在人口学上天然吃亏。
The third is timing. On the same Gompertz life table, a permanent 20% mortality reduction starting at 30 adds 2.5 years of life expectancy; starting at 50 adds 2.3; starting at 70 only 1.5. Even raising the reduction to 50%, starting at 80 adds only 2.9 years, while starting at 20 adds 8.0. A direct corollary of the mathematical proposition: on an exponentially rising hazard, the same relative reduction yields a smaller absolute gain the later it is applied — which is why “anti-ageing only in old age” is demographically disadvantaged.
参考文献 / References
- Medawar, P. B. (1952). An Unsolved Problem of Biology. H. K. Lewis, London.
- Williams, G. C. (1957). Pleiotropy, natural selection, and the evolution of senescence. Evolution 11, 398–411. doi:10.2307/2406060
- Kirkwood, T. B. L. (1977). Evolution of ageing. Nature 270, 301–304. doi:10.1038/270301a0
- Gompertz, B. (1825). On the nature of the function expressive of the law of human mortality. Philosophical Transactions of the Royal Society 115, 513–583. doi:10.1098/rstl.1825.0026
- Hayflick, L., & Moorhead, P. S. (1961). The serial cultivation of human diploid cell strains. Experimental Cell Research 25, 585–621. doi:10.1016/0014-4827(61)90192-6
- Harley, C. B., Futcher, A. B., & Greider, C. W. (1990). Telomeres shorten during ageing of human fibroblasts. Nature 345, 458–460. doi:10.1038/345458a0
- Blasco, M. A., Lee, H.-W., Hande, M. P., Samper, E., Lansdorp, P. M., DePinho, R. A., & Greider, C. W. (1997). Telomere shortening and tumor formation by mouse cells lacking telomerase RNA. Cell 91, 25–34. doi:10.1016/S0092-8674(01)80006-4
- López-Otín, C., Blasco, M. A., Partridge, L., Serrano, M., & Kroemer, G. (2023). Hallmarks of aging: an expanding universe. Cell 186, 243–278. doi:10.1016/j.cell.2022.11.001
- Gorgoulis, V., et al. (2019). Cellular senescence: defining a path forward. Cell 179, 813–827. doi:10.1016/j.cell.2019.10.005
- Yamanaka, S. (2006). Induction of pluripotent stem cells from mouse fibroblasts by four transcription factors. Cell 126, 663–676. doi:10.1016/j.cell.2006.07.024
- Ocampo, A., et al. (2016). In vivo amelioration of age-associated hallmarks by partial reprogramming. Cell 167, 1719–1733. doi:10.1016/j.cell.2016.11.010
- Gill, D., et al. (2022). Multi-omic rejuvenation of human cells by maturation phase transient reprogramming. eLife 11, e71624. doi:10.7554/eLife.71624
- Horvath, S. (2013). DNA methylation age of human tissues and cell types. Genome Biology 14, R115. doi:10.1186/gb-2013-14-10-r115
- Hannum, G., et al. (2013). Genome-wide methylation profiles reveal quantitative views of human aging rates. Molecular Cell 49, 359–367. doi:10.1016/j.molcel.2012.10.016
- Levine, M. E., et al. (2018). An epigenetic biomarker of aging for lifespan and healthspan. Aging 10, 573–591. doi:10.18632/aging.101414
- Lu, A. T., et al. (2019). DNA methylation GrimAge strongly predicts lifespan and healthspan. Aging 11, 303–327. doi:10.18632/aging.101684
- Belsky, D. W., et al. (2022). DunedinPACE, a DNA methylation biomarker of the pace of aging. eLife 11, e73420. doi:10.7554/eLife.73420
- Bell, C. G., et al. (2019). DNA methylation aging clocks: challenges and recommendations. Genome Biology 20, 249. doi:10.1186/s13059-019-1824-9
- Ying, K., et al. (2024). Causality-enriched epigenetic age uncouples damage and adaptation. Nature Aging. doi:10.1038/s43587-023-00557-0
- Harrison, D. E., et al. (2009). Rapamycin fed late in life extends lifespan in genetically heterogeneous mice. Nature 460, 392–395. doi:10.1038/nature08221
- Colman, R. J., et al. (2009). Caloric restriction delays disease onset and mortality in rhesus monkeys. Science 325, 201–204. doi:10.1126/science.1173635
- Mattison, J. A., et al. (2012). Impact of caloric restriction on health and survival in rhesus monkeys from the NIA study. Nature 489, 318–321. doi:10.1038/nature11432
- Mannick, J. B., et al. (2014). mTOR inhibition improves immune function in the elderly. Science Translational Medicine 6, 268ra179. doi:10.1126/scitranslmed.3009892
- Hickson, L. J., et al. (2019). Senolytics decrease senescent cells in humans: preliminary report from a clinical trial of dasatinib plus quercetin in individuals with diabetic kidney disease. EBioMedicine 47, 446–456. doi:10.1016/j.ebiom.2019.08.069
- Bernardes de Jesus, B., et al. (2012). Telomerase gene therapy in adult and old mice delays aging and increases longevity without increasing cancer. EMBO Molecular Medicine 4, 691–704. doi:10.1002/emmm.201200245
- Armitage, P., & Doll, R. (1954). The age distribution of cancer and a multi-stage theory of carcinogenesis. British Journal of Cancer 8, 1–12. doi:10.1038/bjc.1954.1
- Tomasetti, C., & Vogelstein, B. (2015). Variation in cancer risk among tissues can be explained by the number of stem cell divisions. Science 347, 78–81. doi:10.1126/science.aaa1348
- Wu, S., Powers, S., Zhu, W., & Hannun, Y. A. (2016). Substantial contribution of extrinsic risk factors to cancer development. Nature 529, 43–47. doi:10.1038/nature16166
- Blokzijl, F., et al. (2016). Tissue-specific mutation accumulation in human adult stem cells during life. Nature 538, 260–264. doi:10.1038/nature19768
- Olshansky, S. J., et al. (2024). Implausibility of radical life extension in humans in the twenty-first century. Nature Aging. doi:10.1038/s43587-024-00702-3
- Vaupel, J. W. (2010). Biodemography of human ageing. Nature 464, 536–542. doi:10.1038/nature08985
- Oeppen, J., & Vaupel, J. W. (2002). Broken limits to life expectancy. Science 296, 1029–1031. doi:10.1126/science.1069675
- McCay, C. M., Crowell, M. F., & Maynard, L. A. (1935). The effect of retarded growth upon the length of life span and upon the ultimate body size. Journal of Nutrition 10, 63–79. doi:10.1093/jn/10.1.63
- Needham, J. (1974). Science and Civilisation in China, Vol. 5, Part 2: Spagyrical Discovery and Invention. Cambridge University Press.
- Pregadio, F. (ed.) (2008). The Encyclopedia of Taoism. Routledge.
- 司马迁. 《史记·秦始皇本纪》.
- 班固. 《汉书·郊祀志》.
- 葛洪. 《抱朴子内篇》.
- National Library of Medicine. ClinicalTrials.gov identifier NCT07290244 (phase 1 study of AAV-delivered OSK in optic neuropathies). https://clinicaltrials.gov/ct2/show/NCT07290244
引用说明:第 1–33 条为期刊论文或专著,均有 DOI;第 34–38 条为经典文本与学术专著,不适用 DOI;第 39 条为临床试验注册记录。文中所有”实验证据”都可追溯到上述文献或脚本;所有”模型结果”均可由 experiments/ 中的代码重跑;“作者假说”在文中均已标注,不作为证据使用。
Citation note: items 1–33 are journal articles or monographs with DOIs; items 34–38 are classical texts and scholarly monographs, for which a DOI does not apply; item 39 is a trial registration. Every “experimental evidence” claim traces to the references or the scripts; every “model output” can be regenerated from experiments/; “author’s hypotheses” are labelled as such and are not used as evidence.